|
Introduction to Economics University of California, Berkeley Fall 2018 Professor Martha Olney |
Midterm #1 from previous terms
This is the first midterm from Prof. Olney's Fall 2017 offering of Economics 1. The exam was written as a 50 minute exam but administered over 80 minutes.
Question 1 (18 points; 9 minutes) In 2009, the
European Union (EU) purchased 30,000 tons of butter from
European dairy farmers in order to maintain a minimum price that
the EU had established for butter.
A) (6 points) Draw a graph of the short-run 2009 butter market in the EU. Show the market equilibrium price as p*, and the minimum price the government established as pm. Show the market equilibrium quantity as q*, the quantity sold by farmers as qf, and the quantity sold to consumers as qc.
B) (6 points) In the absence of the EU's purchase, the butter market would have been in equilibrium. What was the effect of the EU's purchase on consumer surplus in the butter market? Explain your answer.
C) (6 points) On the graph you drew in part (a), show the producer surplus if the market had reached equilibrium by shading the appropriate area of the graph with vertical hash marks |||. Show the producer surplus with the EU's purchase by shading the appropriate area of the graph with horizontal lines ≡. Explain why the EU's purchase of butter changed producer surplus.
Question 2 (10 points; 5 minutes) This question is based on article #8, "How Chicken Wings Explain Metro's Looming Ridership Problems," by Powers (2017). The Metro in DC is very similar to our Bart system, with the fare dependent upon the distance traveled. The one difference between the two systems is that the Metro charges higher fares during commute time than it does during "off-peak" time.
Based on the factors that affect price elasticity of demand, what are the likely short-run and long-run effects on total revenue of an increase in DC Metro fares? In your answer, distinguish between the effects of increasing fares during commute time and during "off-peak" times.
Question 3 (25 points; 13 minutes) The U.S. Virgin Islands (USVI) is a U.S. territory in the Caribbean. It produces two outputs: tourism and rum. Rum can be made from sugarcane, which grows in the islands.
A) (6 points) Draw a PPF for USVI, putting tourism on the vertical axis and rum on the horizontal axis. Label your PPF as "PPF1." Explain why you drew your PPF with that particular slope and shape.
B) (6 points) USVI acquires new seaports that accommodate large cruise ships carrying thousands of tourists. What effect do the new ports have on USVI's PPF? Why? Show the effect on your graph, using labels with subscripts "2."
C) (5 points) USVI pursues the gains from trade. USVI trades with the mainland. Rum can be manufactured anywhere. USVI has the comparative advantage in tourism. For many years, demand for tourism is quite high and USVI is operating on its PPF. On your PPF drawn above, draw in a point and label it "C" to indicate where USVI produces. Below, defend your choice.
D) (8 points) Hurricanes Irma and Maria destroyed the beautiful sandy beaches and beachfront properties that drew many tourists to USVI. Tourists stop coming to USVI. Without outside aid, can USVI quickly go back to the standard of living it had before the hurricanes? Would your answer be different if USVI had not pursued the gains from trade? Explain your answers.
Question 4 (19 points; 10 minutes)
You are an economist who is asked by the UCB administration to analyze whether the $800,000 security expenditure on Sunday September 24 was a good idea. You tell the administration you first need to know three things
1. their goal
2. the counterfactual
3. the opportunity cost of the funds
A) (10 points) Separately for each of these three items, explain why you need that piece of information (the goal, the counterfactual, the opportunity cost) in order to provide your analysis.
B) (9 points) Think about the four causes of disagreement discussed in article #1 by Fritz Machlup, "Why Economists Disagree," published in 1965. For each of these 3 items (goal, counterfactual, opportunity cost), what is a possible cause of disagreement? Defend your answers.
Question 5 (28 points; 14 minutes)
Consider the market facilitated by Airbnb: the market for renting rooms by the night in houses and apartments
• Sellers are called "hosts." They offer a room for rent. Hosts can be homeowners or apartment leaseholders.
• Buyers are called "guests." They pay hosts in order to rent a room for 1 night or more in a house or apartment
• The price is the nightly rent. The quantity in the market is “room-nights” which is the sum of the number of nights each room is rented, summed over all hosts.
A) (4 points) If the typical economic profit earned by a host is 0, will anyone want to be a host? Explain.
B) (8 points) Assume the market for rented rooms is perfectly competitive and is initially in long run competitive equilibrium. Draw the relevant graphs below for the market and for the typical host. Use subscripts "1" on your labels.
C) (8 points) There is a change: The City of San Francisco now requires all Airbnb hosts to pay a $125 fee to the City each year. The fee must be paid regardless of the number of room-nights sold. What is the SHORT RUN effect of the new city fee on the price of a rented room in a house or apartment? On the typical number of room-nights sold by a host? On the typical profit of a host? On the market quantity of room-nights sold? For each answer (increase, decrease, no change), provide a one sentence defense. Show the effects on your graph above, using subscripts "2" on your labels. (Help yourself and your GSI by using a different color or dashes for your curves in this part.)
D) (8 points) Relative to the short run effects in part c, what are the LONG RUN effects of the new city fee on price, room-nights sold by a typical host, profit of a typical host, the number of hosts, and market quantity of room nights sold? For each answer (increase, decrease, no change), provide a one sentence defense. Show the effects on your graph above, using subscripts "3" on your labels.
This is the first midterm from Prof. Olney's Fall 2016 offering of Economics 1. The exam was written as a 50 minute exam but administered over 80 minutes.
Question 1 (22 points, 11 minutes) Let's
consider two parts of California as two separate economies: the
Central Valley and Silicon Valley. Suppose these economies
produce two products: agricultural products and industrial
products (including high tech and aerospace).
a. (8 points) Initially the two economies each produce a mix of both goods: agricultural products (A) and industrial products (I). Illustrate the production possibilities of the Central Valley economy. Explain why the PPF has the shape it does.
b. (7 points) The Central Valley has fertile land and extensive irrigation systems delivering water to farms. When the irrigation system was installed, it vastly increased agricultural productivity. The Silicon Valley is near two major universities whose graduates are some of the best tech and data scientists in the country. The tech and data scientists are constantly inventing new products and more efficient ways to produce high tech and aerospace goods.
Over time everyone recognizes that the Central Valley has a comparative advantage in the production of agricultural products. Explain why the many fruit trees that once grew in the Silicon Valley no longer exist.
c. (7 points) Which economy -- Central Valley or Silicon Valley -- will grow faster over time? Defend your answer.
Question 2 (10 points, 5 minutes) One candidate says: “The crime rate fell after a particular policing policy was implemented, which is evidence that the policing policy was successful.” The other candidate says: “Wrong.” What is a proper way to evaluate whether the policy was successful?
Question 3 (10 points, 5 minutes) Drawing on the article #5, “How Scalpers Make Their Millions with ‘Hamilton’,” sketch a model of supply and demand that shows why the price of scalped tickets for the July 9 performance was so much greater than it had been in May. Identify the forces that shifted demand and those that shifted supply. In your answer, include enough detail from the article that we know you read the article. (If you didn’t read the article and you try to make stuff up, you’ll earn fewer points than if you are honest and say “I didn’t read it.”)
Question 4 (36 points, 18 minutes) Suppose that pizza is sold in a perfectly competitive market
a. (8 points) Initially, the pizza industry is in long-run competitive equilibrium. Draw the relevant graphs below for the market and for the typical firm. Use subscripts “1” on your labels.
b. (10 points) A new tax on pizza is implemented: $2 per pizza that must be paid to the city. In the short run, what happens to the price of pizza? To the market quantity? To the quantity produced by the typical firm? To the profit of the typical firm? Show the effects on your graph above, using subscripts “2” on your labels. (Help yourself and your GSI by using a different color or dashes for your curves in this part.)
c. (10 points) In the short run, who will bear the greater burden of the tax: buyers or sellers? Defend your answer.
d. (8 points) In the long run, what happens in the pizza industry? Specify the effects on market price, market quantity, typical firm quantity, typical firm profit, and the number of firms. Show the effects on your graph above, using subscripts “3” on your labels.
Question 5 (10 points, 5 minutes) Suppose that sellers could determine every individual buyer's willingness & ability to pay for a product, and then charged each individual that price. If you're willing and able to pay $10, you're charged $10. If I'm willing and able to pay $2.25, I'm charged $2.25. What can you say about the total consumer surplus in that market?
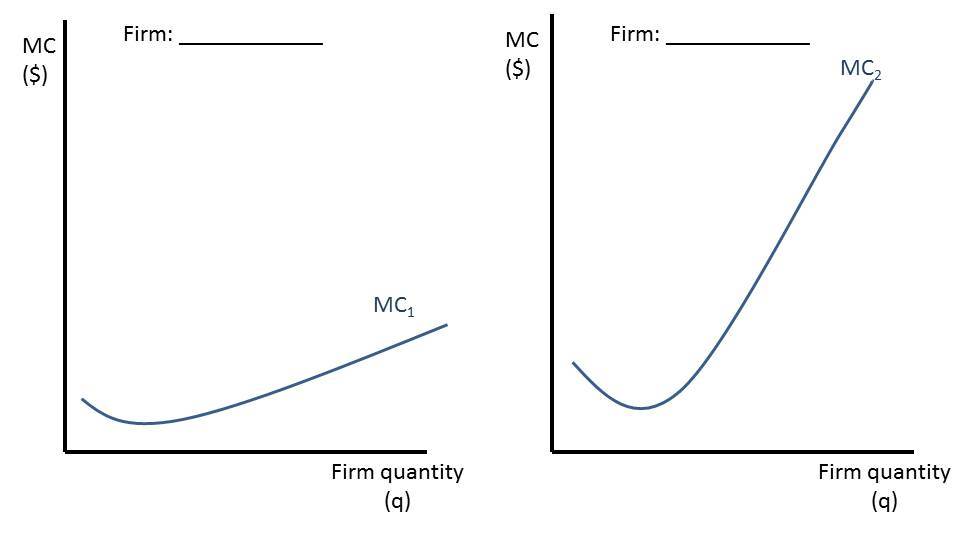
Question 6 (12 points, 6 minutes) Compare two manufacturing firms. One, Spacious Firm (SF) has a 10,000 square foot building with lots of machines. The machines are arranged efficiently so that when additional workers are brought into Spacious Firm, the workers can start producing output right away. The other, Crowded Firm (CF) has a 2,000 square foot building with the same number of machines as Spacious Firm. The machines are crowded onto the factory floor in a haphazard way. When additional workers are brought into Crowded Firm, all workers are bumping into each other and the total output of Crowded Firm only rises a small amount.
Label each of the marginal cost curves below with a label – SF or CF – to indicate which MC curve best describes which firm. Explain your answer. Your explanation should include the concept of “diminishing marginal returns.”
a. (8 points) Initially the two economies each produce a mix of both goods: agricultural products (A) and industrial products (I). Illustrate the production possibilities of the Central Valley economy. Explain why the PPF has the shape it does.
b. (7 points) The Central Valley has fertile land and extensive irrigation systems delivering water to farms. When the irrigation system was installed, it vastly increased agricultural productivity. The Silicon Valley is near two major universities whose graduates are some of the best tech and data scientists in the country. The tech and data scientists are constantly inventing new products and more efficient ways to produce high tech and aerospace goods.
Over time everyone recognizes that the Central Valley has a comparative advantage in the production of agricultural products. Explain why the many fruit trees that once grew in the Silicon Valley no longer exist.
c. (7 points) Which economy -- Central Valley or Silicon Valley -- will grow faster over time? Defend your answer.
Question 2 (10 points, 5 minutes) One candidate says: “The crime rate fell after a particular policing policy was implemented, which is evidence that the policing policy was successful.” The other candidate says: “Wrong.” What is a proper way to evaluate whether the policy was successful?
Question 3 (10 points, 5 minutes) Drawing on the article #5, “How Scalpers Make Their Millions with ‘Hamilton’,” sketch a model of supply and demand that shows why the price of scalped tickets for the July 9 performance was so much greater than it had been in May. Identify the forces that shifted demand and those that shifted supply. In your answer, include enough detail from the article that we know you read the article. (If you didn’t read the article and you try to make stuff up, you’ll earn fewer points than if you are honest and say “I didn’t read it.”)
Question 4 (36 points, 18 minutes) Suppose that pizza is sold in a perfectly competitive market
a. (8 points) Initially, the pizza industry is in long-run competitive equilibrium. Draw the relevant graphs below for the market and for the typical firm. Use subscripts “1” on your labels.
b. (10 points) A new tax on pizza is implemented: $2 per pizza that must be paid to the city. In the short run, what happens to the price of pizza? To the market quantity? To the quantity produced by the typical firm? To the profit of the typical firm? Show the effects on your graph above, using subscripts “2” on your labels. (Help yourself and your GSI by using a different color or dashes for your curves in this part.)
c. (10 points) In the short run, who will bear the greater burden of the tax: buyers or sellers? Defend your answer.
d. (8 points) In the long run, what happens in the pizza industry? Specify the effects on market price, market quantity, typical firm quantity, typical firm profit, and the number of firms. Show the effects on your graph above, using subscripts “3” on your labels.
Question 5 (10 points, 5 minutes) Suppose that sellers could determine every individual buyer's willingness & ability to pay for a product, and then charged each individual that price. If you're willing and able to pay $10, you're charged $10. If I'm willing and able to pay $2.25, I'm charged $2.25. What can you say about the total consumer surplus in that market?
Question 6 (12 points, 6 minutes) Compare two manufacturing firms. One, Spacious Firm (SF) has a 10,000 square foot building with lots of machines. The machines are arranged efficiently so that when additional workers are brought into Spacious Firm, the workers can start producing output right away. The other, Crowded Firm (CF) has a 2,000 square foot building with the same number of machines as Spacious Firm. The machines are crowded onto the factory floor in a haphazard way. When additional workers are brought into Crowded Firm, all workers are bumping into each other and the total output of Crowded Firm only rises a small amount.
Label each of the marginal cost curves below with a label – SF or CF – to indicate which MC curve best describes which firm. Explain your answer. Your explanation should include the concept of “diminishing marginal returns.”
This is the first midterm from Prof. Olney's Fall 2015 offering of Economics 1. The exam was written as a 50 minute exam.
Question 1 (20 points total; 9 minutes total)
Many tourists climb Mt Fuji in Japan, which is one of the world’s highest mountains: over 12,000 feet or 3,700 meters tall. Tourists can purchase water along the route at huts. The higher a tourist climbs up the mountain, the higher is the price of 1 liter of water. So a tourist pays more for 1 liter of water at the 10,000' hut than at the 7,000' hut. Assume water sellers on Mt. Fuji are profit-maximizers. And (even though it’s unrealistic) assume perfect competition.
a. (5 points) Water sold at huts is carried up the mountain by workers, not by vehicles. Referring to the costs of production, explain why sellers would charge a higher price for 1 liter of water at a higher elevation.
b. (5 points) Most tourists bring their own water, but drink it all before reaching the peak. Referring to the demand for water, explain why sellers would charge a higher price for 1 liter of water at a higher elevation.
c. (10 points) We learn that more water is sold at higher elevations than at lower elevations. Does that information help you determine whether differences in supply or differences in demand are primarily responsible for the price differences? Explain. Supplement your answer with a graph.
Question 2 (10 points; 4 minutes) Royal Dutch Shell is a profit-maximizing company that produces and sells oil. Last week, Shell announced it would immediately stop all offshore oil drilling in the Arctic, even though it had already spent $7 billion on the project. They stated that oil prices were expected to remain low and future drilling costs were expected to rise. Using economic terminology, explain Shell’s decision to immediately stop Arctic drilling. In your answer, be sure to indicate whether the $7 billion already spent on the project is relevant to their decision.
Question 3 (40 points; 18 minutes total)
In Oregon, farms can grow apples or grapes. Grapes are used to make wine. There are hundreds of small farms growing grapes and producing wine. Assume the Oregon wine industry is perfectly competitive.
a. (8 points) Initially, the Oregon wine industry was in long-run competitive equilibrium. Draw the relevant graphs below for the market and for the typical firm. Use subscripts “1” on your labels.
b. (12 points) Oregon wine becomes much more popular with consumers. In the short run, what happens to the price of Oregon wine? To the market quantity? To the quantity produced by the typical firm? To the profit of the typical firm? Show the effects on your graph above, using subscripts “2” on your labels.
c. (8 points) In the long run, what happens in the Oregon wine industry? Specify the effects on market price, market quantity, typical firm quantity, typical firm profit, and the number of firms. Show the effects on your graph above, using subscripts “3” on your labels.
d. (6 points) You can see the effect of the increased popularity of Oregon wine as you drive through Oregon: acres and acres of apple trees have been torn out, replaced with acres and acres of grape vineyards. Each time 10 acres of Oregon land is converted from apple orchards to grape vineyards, does Oregon’s production of apples fall by the same amount? Explain.
e. (6 points) Draw Oregon’s PPF (the two outputs are apples and grapes). Illustrate two things in one graph:
• your answer to part (c), the long-run adjustment
• your answer to part (d), the effect on apple production of converting apple orchards to vineyards
Briefly explain your graph.
Question 4 (30 points; 13 minutes) This question draws on the three reader articles (#9a, 9b, 9c) about Uber.
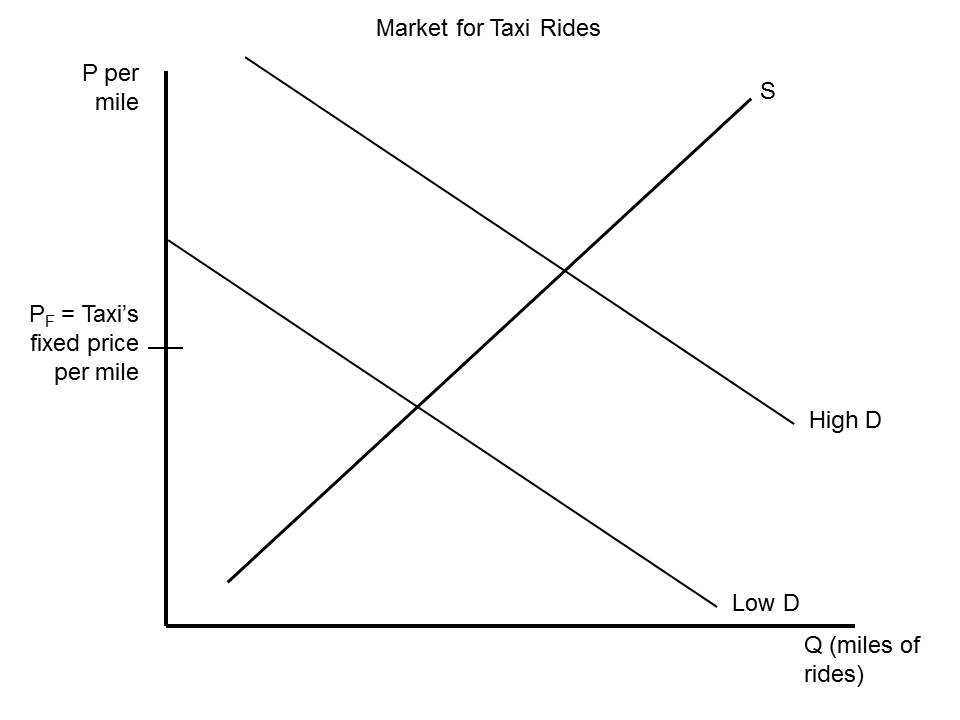
a. (10 points) Taxi rides are sold at a fixed price. The price does not fall or rise in response to changes in demand. The graph at the right illustrates this market. When is the fixed price a price ceiling: when demand is low or when demand is high? When demand is high, will taxi rides go only to the people with the highest ability and willingness to pay? Explain.
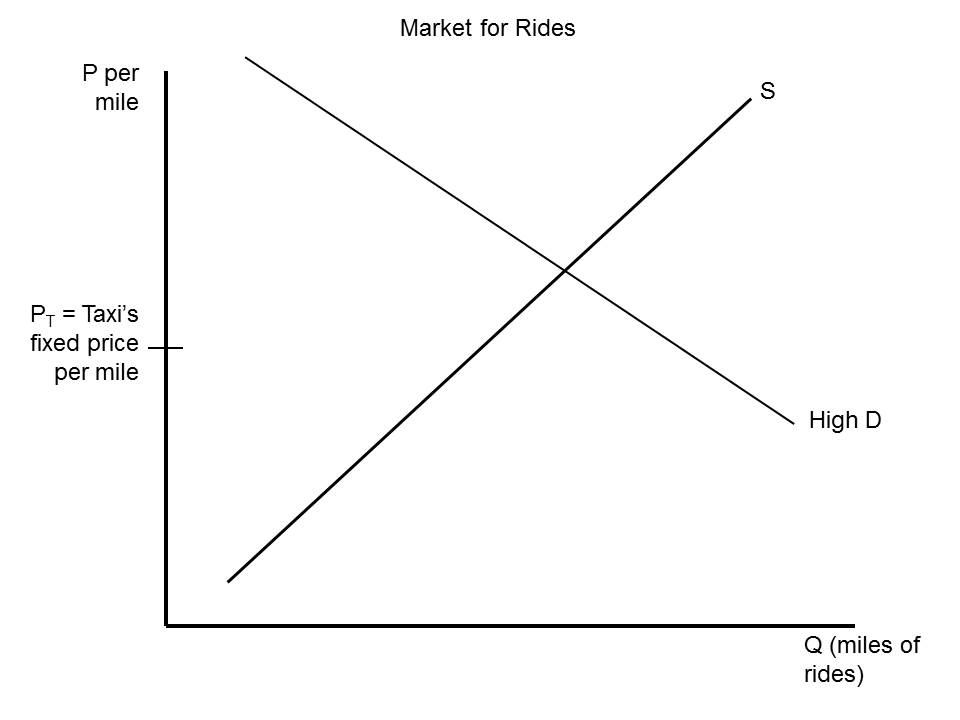
b. (10 points) What is Uber’s “surge pricing”? Use the model of supply and demand to illustrate at right the market for Uber rides. In your graph, distinguish between a low-demand time and a high-demand time.
c. (10 points) When demand is high, is Uber price-gouging? In your answer, distinguish between a high-demand time such as Halloween or New Year’s Eve and a high-demand time such as an unexpected closure of all public transit (Bart, bus, etc.).
Many tourists climb Mt Fuji in Japan, which is one of the world’s highest mountains: over 12,000 feet or 3,700 meters tall. Tourists can purchase water along the route at huts. The higher a tourist climbs up the mountain, the higher is the price of 1 liter of water. So a tourist pays more for 1 liter of water at the 10,000' hut than at the 7,000' hut. Assume water sellers on Mt. Fuji are profit-maximizers. And (even though it’s unrealistic) assume perfect competition.
a. (5 points) Water sold at huts is carried up the mountain by workers, not by vehicles. Referring to the costs of production, explain why sellers would charge a higher price for 1 liter of water at a higher elevation.
b. (5 points) Most tourists bring their own water, but drink it all before reaching the peak. Referring to the demand for water, explain why sellers would charge a higher price for 1 liter of water at a higher elevation.
c. (10 points) We learn that more water is sold at higher elevations than at lower elevations. Does that information help you determine whether differences in supply or differences in demand are primarily responsible for the price differences? Explain. Supplement your answer with a graph.
Question 2 (10 points; 4 minutes) Royal Dutch Shell is a profit-maximizing company that produces and sells oil. Last week, Shell announced it would immediately stop all offshore oil drilling in the Arctic, even though it had already spent $7 billion on the project. They stated that oil prices were expected to remain low and future drilling costs were expected to rise. Using economic terminology, explain Shell’s decision to immediately stop Arctic drilling. In your answer, be sure to indicate whether the $7 billion already spent on the project is relevant to their decision.
Question 3 (40 points; 18 minutes total)
In Oregon, farms can grow apples or grapes. Grapes are used to make wine. There are hundreds of small farms growing grapes and producing wine. Assume the Oregon wine industry is perfectly competitive.
a. (8 points) Initially, the Oregon wine industry was in long-run competitive equilibrium. Draw the relevant graphs below for the market and for the typical firm. Use subscripts “1” on your labels.
b. (12 points) Oregon wine becomes much more popular with consumers. In the short run, what happens to the price of Oregon wine? To the market quantity? To the quantity produced by the typical firm? To the profit of the typical firm? Show the effects on your graph above, using subscripts “2” on your labels.
c. (8 points) In the long run, what happens in the Oregon wine industry? Specify the effects on market price, market quantity, typical firm quantity, typical firm profit, and the number of firms. Show the effects on your graph above, using subscripts “3” on your labels.
d. (6 points) You can see the effect of the increased popularity of Oregon wine as you drive through Oregon: acres and acres of apple trees have been torn out, replaced with acres and acres of grape vineyards. Each time 10 acres of Oregon land is converted from apple orchards to grape vineyards, does Oregon’s production of apples fall by the same amount? Explain.
e. (6 points) Draw Oregon’s PPF (the two outputs are apples and grapes). Illustrate two things in one graph:
• your answer to part (c), the long-run adjustment
• your answer to part (d), the effect on apple production of converting apple orchards to vineyards
Briefly explain your graph.
Question 4 (30 points; 13 minutes) This question draws on the three reader articles (#9a, 9b, 9c) about Uber.
a. (10 points) Taxi rides are sold at a fixed price. The price does not fall or rise in response to changes in demand. The graph at the right illustrates this market. When is the fixed price a price ceiling: when demand is low or when demand is high? When demand is high, will taxi rides go only to the people with the highest ability and willingness to pay? Explain.
b. (10 points) What is Uber’s “surge pricing”? Use the model of supply and demand to illustrate at right the market for Uber rides. In your graph, distinguish between a low-demand time and a high-demand time.
c. (10 points) When demand is high, is Uber price-gouging? In your answer, distinguish between a high-demand time such as Halloween or New Year’s Eve and a high-demand time such as an unexpected closure of all public transit (Bart, bus, etc.).
This is the first midterm from Prof. Olney's Fall 2014 offering of Economics 1. The exam was written as a 50 minute exam.
Question 1 (16 points total; 7 minutes total)
A. (8 points) Base your answers on the articles #10a, "Where Car Is King, Smartphones May Cut Traffic," by Ian Lovett, New York Times, July 12, 2013 and #10b, "‘Bandit' Cabs are Bad for Drivers and Passengers," by Veena Dubal, San Francisco Chronicle, August 20, 2013.
Use a model of supply and demand to show in a graph the effect of Lyft on the price of a taxi ride. Explain your graph. Do both taxi drivers and Lyft drivers face the same costs of providing a ride? In your answer, include enough detail from the article so that we know you read the articles. An answer that makes stuff up gets fewer points than an answer which honestly states "I didn't read the articles."
 B. (8
points) Ride-sharing services charge a market price. Regulated
taxis charge a fixed price that does not change when demand
changes. In which case – with ride-sharing services or taxis –
is there more consumer surplus on evenings when demand is
high? Explain, supplementing your answer with a graph. We
have started the graph for you. (You don’t need to link your
answer to the reader articles.)
B. (8
points) Ride-sharing services charge a market price. Regulated
taxis charge a fixed price that does not change when demand
changes. In which case – with ride-sharing services or taxis –
is there more consumer surplus on evenings when demand is
high? Explain, supplementing your answer with a graph. We
have started the graph for you. (You don’t need to link your
answer to the reader articles.)
Question 2 (38 points total; 17 minutes total)
Selling bottled water outside the Cal football stadium requires only bottles of water, ice, and a cooler that contains the ice & bottles. The market is initially in long-run competitive equilibrium with the typical seller earning zero economic profit.
A. (6 points) The accounting profit from selling bottled water is very low. Who is more likely to sell bottled water: teenagers or corporate executives? Defend your answer.
B. (7 points) It’s a hot day in Berkeley: the temperature at game time will be 85̊. In the short run, assuming all else is constant, what effect does the change in weather have on the market equilibrium price of bottled water? On the equilibrium quantity of bottled water sold? Briefly explain your answers. (No graph here; that will be in part c.)
C. (10 points) For the typical bottled water seller in this perfectly competitive market, what is the short-run effect of the change in weather on the profit-maximizing quantity? What is the short-run effect on profit? Supplement your answer with a graph. Use subscripts "1" to show the initial (not hot day) positions. Use subscripts "2" to label the curves, points, and area that show the short-run effects of the hot weather.
D. (10 points) In the long run, what will happen in the market for bottled water? What happens to the profit-maximizing quantity and profits of the typical seller of bottled water? Briefly explain. On your graphs above, show the effects using subscripts "3" to label the curves, points, and area that show the long-run effects.
E. (5 points) In this market, how long do you think it will take to adjust to the new long run equilibrium: hours, days, or weeks? Defend your answer.
Question 3 (24 points total; 11 minutes total)
Manuel owns two ice cream shops:
• one near a large urban high school, on a street with four other shops selling sweet treats
• one in a high-income suburb, in a mall where Manuel has the only shop selling sweet treats
A. (6 points) In which location – the urban shop near the high school, or the suburban shop in the mall – is demand for ice cream cones most likely to be relatively price elastic? Give one reason for your answer.
B. (8 points) Manuel initially charges $2 per ice cream cone. He wants to increase revenue. In which location – the urban shop near the high school, or the suburban shop in the mall – should he lower the price to $1? Defend your answer.
C. (10 points) In both locations, a new tax of 25¢ per ice cream cone is implemented. In which location – the urban shop near the high school, or the suburban shop in the mall – will the consumer bear the larger burden of the tax? Explain your answer. Draw a graph (or two, if that is easier for you) that supports your answer.
Question 4 (22 points total; 10 minutes total)
Consider the Massachusetts (MA) economy in about 1800. Two goods were produced: manufactured goods and farm goods.
• Because of its many rivers and abundant timber, Massachusetts had high productivity in manufacturing.
• Because of its rocky soil & climate, Massachusetts had low productivity in food production.
A. (4 points) Draw a production possibilities frontier depicting the Massachusetts economy in about 1800. Put manufactured goods on the vertical axis & farm goods on the horizontal axis. Label it “PPF1.” (No words needed, just the graph).
B. (8 points) Many people moved to Massachusetts from Europe in the early 1800s, increasing the labor force. Would this result in symmetric or asymmetric growth? Explain. Show the effect on your graph, labeling it “PPF2.”
C. (10 points) Pennsylvania (PA) is nearby and produced the same two goods.
• Transportation between the two economies is relatively cheap.
• Manufacturing productivity was about the same in Pennsylvania as in Massachusetts.
• But because of Pennsylvania’s very fertile soil and milder winters, productivity in food production was much higher in Pennsylvania than in Massachusetts.
Trade begins between Massachusetts and Pennsylvania. Will there be gains from trade? Which economy will specialize in manufactured good production? In food production? Defend your answers.
A. (8 points) Base your answers on the articles #10a, "Where Car Is King, Smartphones May Cut Traffic," by Ian Lovett, New York Times, July 12, 2013 and #10b, "‘Bandit' Cabs are Bad for Drivers and Passengers," by Veena Dubal, San Francisco Chronicle, August 20, 2013.
Use a model of supply and demand to show in a graph the effect of Lyft on the price of a taxi ride. Explain your graph. Do both taxi drivers and Lyft drivers face the same costs of providing a ride? In your answer, include enough detail from the article so that we know you read the articles. An answer that makes stuff up gets fewer points than an answer which honestly states "I didn't read the articles."
B. (8
points) Ride-sharing services charge a market price. Regulated
taxis charge a fixed price that does not change when demand
changes. In which case – with ride-sharing services or taxis –
is there more consumer surplus on evenings when demand is
high? Explain, supplementing your answer with a graph. We
have started the graph for you. (You don’t need to link your
answer to the reader articles.)Question 2 (38 points total; 17 minutes total)
Selling bottled water outside the Cal football stadium requires only bottles of water, ice, and a cooler that contains the ice & bottles. The market is initially in long-run competitive equilibrium with the typical seller earning zero economic profit.
A. (6 points) The accounting profit from selling bottled water is very low. Who is more likely to sell bottled water: teenagers or corporate executives? Defend your answer.
B. (7 points) It’s a hot day in Berkeley: the temperature at game time will be 85̊. In the short run, assuming all else is constant, what effect does the change in weather have on the market equilibrium price of bottled water? On the equilibrium quantity of bottled water sold? Briefly explain your answers. (No graph here; that will be in part c.)
C. (10 points) For the typical bottled water seller in this perfectly competitive market, what is the short-run effect of the change in weather on the profit-maximizing quantity? What is the short-run effect on profit? Supplement your answer with a graph. Use subscripts "1" to show the initial (not hot day) positions. Use subscripts "2" to label the curves, points, and area that show the short-run effects of the hot weather.
D. (10 points) In the long run, what will happen in the market for bottled water? What happens to the profit-maximizing quantity and profits of the typical seller of bottled water? Briefly explain. On your graphs above, show the effects using subscripts "3" to label the curves, points, and area that show the long-run effects.
E. (5 points) In this market, how long do you think it will take to adjust to the new long run equilibrium: hours, days, or weeks? Defend your answer.
Question 3 (24 points total; 11 minutes total)
Manuel owns two ice cream shops:
• one near a large urban high school, on a street with four other shops selling sweet treats
• one in a high-income suburb, in a mall where Manuel has the only shop selling sweet treats
A. (6 points) In which location – the urban shop near the high school, or the suburban shop in the mall – is demand for ice cream cones most likely to be relatively price elastic? Give one reason for your answer.
B. (8 points) Manuel initially charges $2 per ice cream cone. He wants to increase revenue. In which location – the urban shop near the high school, or the suburban shop in the mall – should he lower the price to $1? Defend your answer.
C. (10 points) In both locations, a new tax of 25¢ per ice cream cone is implemented. In which location – the urban shop near the high school, or the suburban shop in the mall – will the consumer bear the larger burden of the tax? Explain your answer. Draw a graph (or two, if that is easier for you) that supports your answer.
Question 4 (22 points total; 10 minutes total)
Consider the Massachusetts (MA) economy in about 1800. Two goods were produced: manufactured goods and farm goods.
• Because of its many rivers and abundant timber, Massachusetts had high productivity in manufacturing.
• Because of its rocky soil & climate, Massachusetts had low productivity in food production.
A. (4 points) Draw a production possibilities frontier depicting the Massachusetts economy in about 1800. Put manufactured goods on the vertical axis & farm goods on the horizontal axis. Label it “PPF1.” (No words needed, just the graph).
B. (8 points) Many people moved to Massachusetts from Europe in the early 1800s, increasing the labor force. Would this result in symmetric or asymmetric growth? Explain. Show the effect on your graph, labeling it “PPF2.”
C. (10 points) Pennsylvania (PA) is nearby and produced the same two goods.
• Transportation between the two economies is relatively cheap.
• Manufacturing productivity was about the same in Pennsylvania as in Massachusetts.
• But because of Pennsylvania’s very fertile soil and milder winters, productivity in food production was much higher in Pennsylvania than in Massachusetts.
Trade begins between Massachusetts and Pennsylvania. Will there be gains from trade? Which economy will specialize in manufactured good production? In food production? Defend your answers.