Midterm #2 from previous terms
This is the second midterm from Prof. Olney's Fall 2017 offering of Economics 1. The exam was written as a 50 minute exam but administered over 80 minutes.
Question 1 (12 points; 6 minutes)
Suppose the economy can be described by the following equations (all values are billions of dollars per year)
C = 900 + 0.6YD G = 800 EX = 200 TR = 100 I = 300 IM = 300 TA = 600
What is the equilibrium level of output and income? Show all your work or you will receive zero (0) points on this question. If you cannot solve this problem without a calculator, set it up and go as far as you can to receive as much partial credit as possible. No calculators allowed during the exam.
Question 2 (15 points, 8 minutes)
A) (5 points) Provide an example of an activity that would be recorded in both C and IM in the U.S. expenditure accounts. Your example should have $ values associated with it. What $ amount would be recorded in C? What $ amount would be recorded in IM?
B) (5 points) Is the U.S. economy currently in an unemployment equilibrium? Defend your answer.
C) (5 points) Real GDP is tightly linked to (that is, correlated with) employment. Explain why nominal GDP is not tightly linked to employment.
Question 3 (20 points total; 10 minutes total)
Part b of this question is based on two articles:
• #10b, “Economic Growth in the United States: A Tale of Two Countries,” by Thomas Piketty, Emmanuel Saez, and Gabriel Zucman. Washington Center for Equitable Growth blog, December 6, 2016.
• #18, “Wealth Inequality and the Marginal Propensity to Consume,” by Nick Bunker, Washington Center for Equitable Growth, December 17, 2014.
A) (10 points) A cut in taxes boosts disposable income, leading households to increase consumer spending. Explain why the total increase in GDP should be larger than the initial increase in consumer spending triggered by a tax cut. Be clear and be complete. Simply mentioning the name of a concept is insufficient.
B) (10 points) Suppose that the top 1 percent income earners studied in the work by Piketty, Saez, and Zucman (shorthand “PSZ,” #10b) have much greater wealth than the bottom 50 percent studied by PSZ. Over the period 1962-2014, what were the patterns of the share of income accruing to the bottom 50 percent and the top 1 percent of income earners? Based on the findings in the Bunker article (#18), what is the effect of those patterns shown in PSZ on the size of the multiplier over the period 1962-2014? Explain your answer. (Your answer should make it clear that you read the articles.)
Question 4 (25 points total; 13 minutes total)
Inspired by https://ww2.kqed.org/news/2017/10/30/is-a-hollywood-tax-credit-still-needed-to-protect-industry-jobs/
Consider the activity “filming a movie or TV series.” Hollywood film studios employ a large number of people when they make a movie or shoot a television series. Although the studios have their headquarters in Hollywood, CA, they can choose where to do the filming – in California or elsewhere. Starting in 2014, the state of California offered large subsidies to film studios that chose to do their filming in California rather than elsewhere.
A) (4 points) Give and defend one example of a positive externality associated with filming a movie or TV series in California.
B) (5 points) Is filming a movie or TV series a situation in which the Coase Theorem applies? Defend your answer.
C) (10 points) California pays subsidies of $330 million annually to Hollywood film studios who choose to film in California. Draw graphs that illustrate the positive externality associated with filming in California and, separately, the effect of the subsidy. The quantity is the number of movies or TV episodes filmed in CA per year.
D) (6 points) State legislators have to decide soon whether to extend the subsidy program beyond its expiration in 2020. What do they need to know in order to determine if the subsidy is the optimal size? Explain.
Question 5 (16 points; 8 minutes)
A) (8 points) Why does a decrease in interest rates typically lead to an increase in investment spending? In your answer, be sure to distinguish between the interest rate(s) that are relevant for firms using internal finance versus the interest rate(s) that are relevant for firms using external finance.
B) (8 points) The expected rate of return on a potential investment project is 2 percent. That 2 percent is a mean (or, average) of a distribution of possible returns ranging from -1 to +3 percent. If the business owners are loss averse, will a drop in interest rates from 2.5 to 1.5 percent necessarily lead to an increase in investment spending? Explain your answer. (Your explanation should make it clear to your GSI that you know what it means to be “loss averse.”)
Question 6 (12 points total; 6 minutes total)
A) (6 points) At the right, draw a graph that shows a monopolistically competitive firm in long run equilibrium.
B) (6 points) For a monopoly, profit can be greater than zero in the long run. Explain why profit is equal to zero in the long run for a monopolistically competitive firm but not for a monopolist.
This is the second midterm from Prof. Olney's Fall 2016 offering of Economics 1. The exam was written as a 50 minute exam but administered over 80 minutes.
Question 1 (15 points; 8 minutes)
Suppose the economy can be described by the following equations (all values are billions of dollars per month)
C = 180 + 0.4YD EX = 200 TR = 400 I = 100 IM = 100 TA = 600 G = 300
What is the equilibrium level of output and income? Show all your work or you will receive zero (0) points on this question. If you cannot solve this problem without a calculator, set it up and go as far as you can to receive as much partial credit as possible. No calculators allowed during the exam.
Question 2 (6 points, 3 minutes)
Where are each of the following activities recorded in the U.S. GDP expenditure accounts? (Possible answers: C, I, G, EX, IM, or not recorded) Defend your answers. (And then choose a mix of two)
During World War II, the U.S. federal government increased its purchases of good and services from $6.5 billion in 1940 to almost $100 billion in 1944. GDP in 1940 was $101 billion, so you can see what an enormous increase in G this was.
a) (10 points) Explain why the total increase in GDP should be larger than the initial increase in government spending. Be clear and be complete. Simply mentioning the name of a concept is insufficient.
b) (7 points) During World War II, U.S. consumers faced “consumer rationing.” Consumers were not allowed to purchase cars and appliances. Consumers could purchase other items such as sugar, flour, and meat, only in limited amounts. Explain why the change in GDP from each additional $1 billion in government spending is smaller when there is rationing during World War II than when there is no rationing after the war.
Question 4 (20 points total; 10 minutes total)
An oil or gas pipeline laid across land creates the risk of environmental damage from leaks or explosion and fire (such as the explosion in Alabama on October 31). A large private oil company wants to construct a pipeline across land in the upper midwest of the United States. Thousands of people who live near the proposed pipeline are opposed to its construction and want construction stopped.
a) (6 points) Is this a situation in which the Coase Theorem applies? Why or why not?
b) (14 points) Two proposals have been offered to address the concerns of people opposed to the pipeline construction.
• Proposal 1: Make the oil company pay a penalty now to offset the expected costs of future leaks or other environmental damage
• Proposal 2: Stop construction of the pipeline
Under what conditions would proposal 1 generate the socially optimal quantity of pipeline construction? Is there a situation in which proposal 2 would generate the socially optimal quantity of pipeline construction? Explain your answers. Draw a graph at the right that demonstrates a situation in which proposal 2 is optimal.
Question 5 (10 points; 5 minutes)
Under the Affordable Care Act (also known as Obamacare), everyone is required to do one of two things:
• Have health insurance coverage
• Pay a penalty for not being insured. The minimum penalty for 2017 is $695
The population can be divided into two groups of people: [1] healthy people under the age of 30 and [2] everyone else, including the unhealthy people. If healthy people under the age of 30 choose to pay the penalty rather than buy insurance, use asymmetric information concepts to explain what will happen in health insurance markets over time.
Question 6 (6 points; 3 minutes)
Based on the article “The Problem with Poor Countries’ GDP,” by Bill Gates, Project Syndicate, May 6, 2013, discuss why household surveys would provide better information than official GDP statistics for policy makers working in very poor countries.
Question 7 (10 points; 5 minutes)
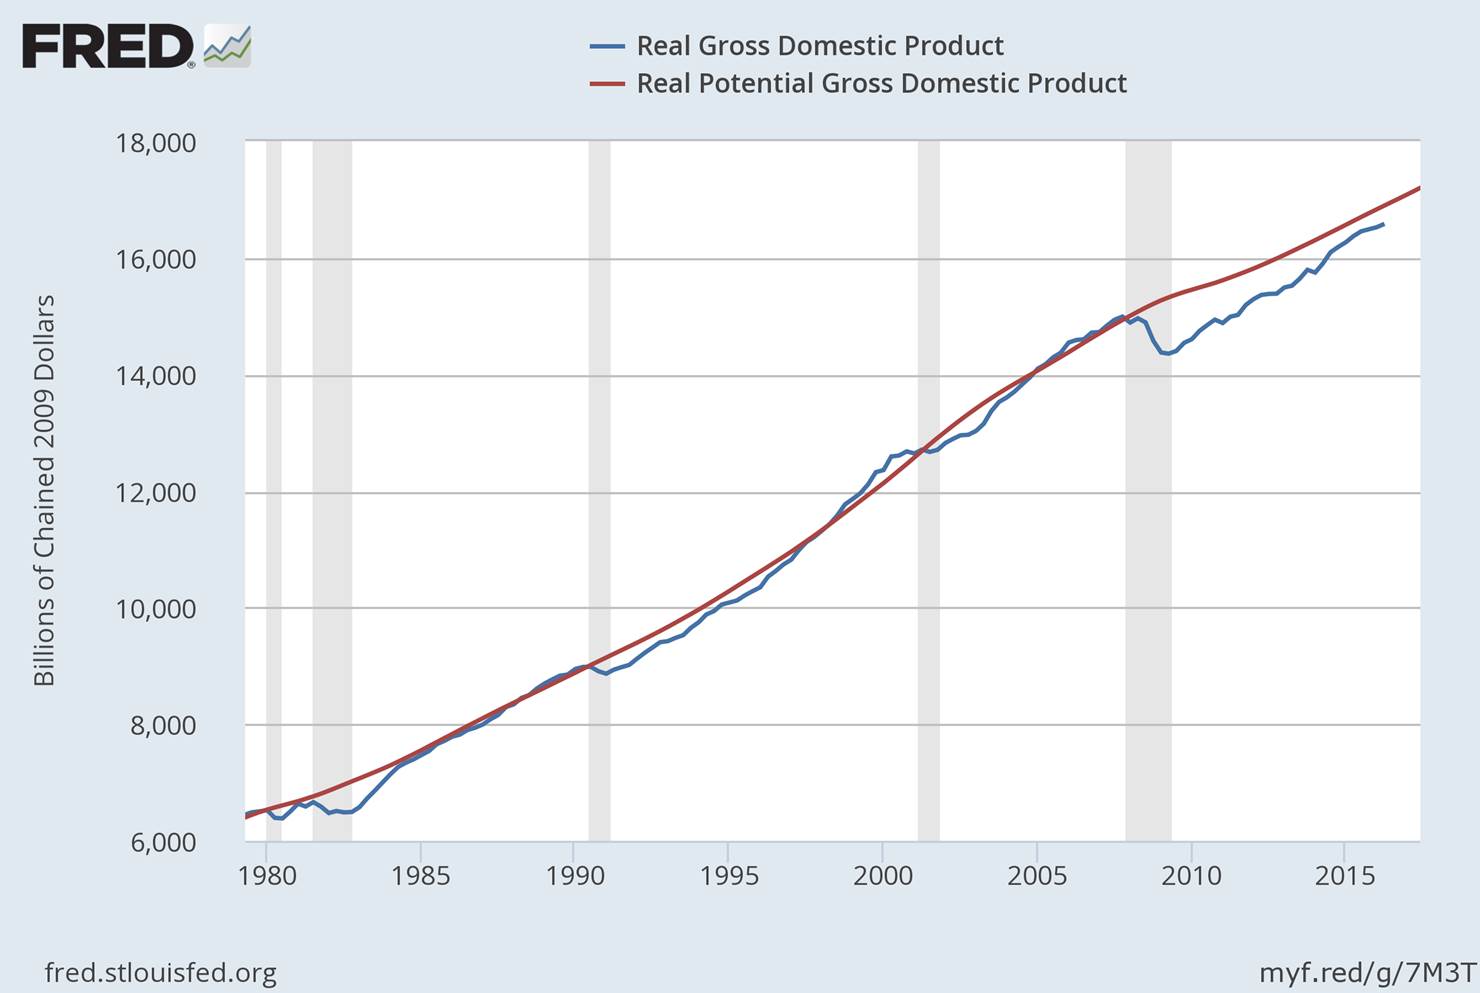 This graph shows actual real GDP
(dashed line) for the U.S. and the Congressional Budget Office
(CBO) estimate of potential real GDP (solid line). The CBO
estimate is the official estimate of what the U.S. economy could
produce at full employment. Based on the graph, in what
time periods was the U.S. economy operating on its production
possibilities frontier? Is the U.S. economy currently in
an unemployment equilibrium? Defend your answers.
This graph shows actual real GDP
(dashed line) for the U.S. and the Congressional Budget Office
(CBO) estimate of potential real GDP (solid line). The CBO
estimate is the official estimate of what the U.S. economy could
produce at full employment. Based on the graph, in what
time periods was the U.S. economy operating on its production
possibilities frontier? Is the U.S. economy currently in
an unemployment equilibrium? Defend your answers.
Question 8 (16 points total; 8 minutes total)
The restaurant industry can be described as monopolistically competitive.
a) (6 points) Draw a graph that depicts a typical restaurant in the restaurant industry in long run equilibrium.
b) (10 points) When the economy entered the Great Recession, job losses and income cuts lowered the demand for restaurant meals. What is the effect on the typical restaurant in the short run? In the long run? Explain your answers.
Suppose the economy can be described by the following equations (all values are billions of dollars per month)
C = 180 + 0.4YD EX = 200 TR = 400 I = 100 IM = 100 TA = 600 G = 300
What is the equilibrium level of output and income? Show all your work or you will receive zero (0) points on this question. If you cannot solve this problem without a calculator, set it up and go as far as you can to receive as much partial credit as possible. No calculators allowed during the exam.
Question 2 (6 points, 3 minutes)
Where are each of the following activities recorded in the U.S. GDP expenditure accounts? (Possible answers: C, I, G, EX, IM, or not recorded) Defend your answers. (And then choose a mix of two)
A California resident buys a copy of today’s New York TimesQuestion 3 (17 points total; 9 minutes total)
A small business in California buys a copy of today’s New York Times
The Berkeley Public Library buys a copy of today’s New York Times
An international student attending UC Berkeley buys a copy of today’s New York Times
During World War II, the U.S. federal government increased its purchases of good and services from $6.5 billion in 1940 to almost $100 billion in 1944. GDP in 1940 was $101 billion, so you can see what an enormous increase in G this was.
a) (10 points) Explain why the total increase in GDP should be larger than the initial increase in government spending. Be clear and be complete. Simply mentioning the name of a concept is insufficient.
b) (7 points) During World War II, U.S. consumers faced “consumer rationing.” Consumers were not allowed to purchase cars and appliances. Consumers could purchase other items such as sugar, flour, and meat, only in limited amounts. Explain why the change in GDP from each additional $1 billion in government spending is smaller when there is rationing during World War II than when there is no rationing after the war.
Question 4 (20 points total; 10 minutes total)
An oil or gas pipeline laid across land creates the risk of environmental damage from leaks or explosion and fire (such as the explosion in Alabama on October 31). A large private oil company wants to construct a pipeline across land in the upper midwest of the United States. Thousands of people who live near the proposed pipeline are opposed to its construction and want construction stopped.
a) (6 points) Is this a situation in which the Coase Theorem applies? Why or why not?
b) (14 points) Two proposals have been offered to address the concerns of people opposed to the pipeline construction.
• Proposal 1: Make the oil company pay a penalty now to offset the expected costs of future leaks or other environmental damage
• Proposal 2: Stop construction of the pipeline
Under what conditions would proposal 1 generate the socially optimal quantity of pipeline construction? Is there a situation in which proposal 2 would generate the socially optimal quantity of pipeline construction? Explain your answers. Draw a graph at the right that demonstrates a situation in which proposal 2 is optimal.
Question 5 (10 points; 5 minutes)
Under the Affordable Care Act (also known as Obamacare), everyone is required to do one of two things:
• Have health insurance coverage
• Pay a penalty for not being insured. The minimum penalty for 2017 is $695
The population can be divided into two groups of people: [1] healthy people under the age of 30 and [2] everyone else, including the unhealthy people. If healthy people under the age of 30 choose to pay the penalty rather than buy insurance, use asymmetric information concepts to explain what will happen in health insurance markets over time.
Question 6 (6 points; 3 minutes)
Based on the article “The Problem with Poor Countries’ GDP,” by Bill Gates, Project Syndicate, May 6, 2013, discuss why household surveys would provide better information than official GDP statistics for policy makers working in very poor countries.
Question 7 (10 points; 5 minutes)
This graph shows actual real GDP
(dashed line) for the U.S. and the Congressional Budget Office
(CBO) estimate of potential real GDP (solid line). The CBO
estimate is the official estimate of what the U.S. economy could
produce at full employment. Based on the graph, in what
time periods was the U.S. economy operating on its production
possibilities frontier? Is the U.S. economy currently in
an unemployment equilibrium? Defend your answers.Question 8 (16 points total; 8 minutes total)
The restaurant industry can be described as monopolistically competitive.
a) (6 points) Draw a graph that depicts a typical restaurant in the restaurant industry in long run equilibrium.
b) (10 points) When the economy entered the Great Recession, job losses and income cuts lowered the demand for restaurant meals. What is the effect on the typical restaurant in the short run? In the long run? Explain your answers.
This is the second midterm from Prof. Olney's Fall 2015 offering of Economics 1. The exam was written as a 50 minute exam.
Question 1 (15 points; 7 minutes)
Suppose the economy can be described by the following equations (all values are billions of dollars per year):
C = 2,800 + 0.4YD EX = 3,000 TR = 1,000
I = 2,000 IM = 1,000 + 0.1Y TA = 3,000
G = 1,000
What is the equilibrium level of output and income? Show all your work or you will receive zero (0) points on this question. If you cannot solve this problem without a calculator, set it up and go as far as you can to receive as much partial credit as possible. No calculators allowed during the exam.
Question 2 (5 points, 2 minutes)
Where is the following activity recorded in the U.S. GDP expenditure accounts? (Possible answers: C, I, G, EX, IM, or not recorded) Defend your answer.
Google pays $200,000 per month to a bus company that will drive Google employees to and from work
Question 3 (10 points; 4 minutes)
Many economists think the U.S. economy is at full employment whenever the unemployment rate is 5 percent or lower. The unemployment rate for October 2015, announced Friday morning, was 5.0 percent.
a. (4 points) Are we in an “unemployment equilibrium”? Explain.
b. (6 points) Referring to article #16 (“Yellen's Philosophy: The More Jobs Data, the Better”), what are 2 other items of jobs data you could gather to determine whether the U.S. economy is on or inside of its production possibilities frontier (PPF)? For each item, what information does it provide about the economy?
Question 4 (10 points, 4 minutes)
a. (4 points) Why can’t monopolistically competitive firms earn economic profit in the long run?
b. (6 points) Why is the adjustment to long run equilibrium shown as a shift of demand in monopolistic competition but as a shift of supply in perfect competition?
Question 5 (35 points; 16 minutes) In Fall 2008, interest rates in the U.S. were decreased.
a) (6 points) How should investment spending have reacted to the Fall 2008 drop in interest rates? Explain why.
b) (7 points) In Fall 2008, the economy was collapsing rapidly and most people were surprised and confused. Business uncertainty rose dramatically. With reference to article #20 in the reader (“Holding on for Tomorrow: How Economic Uncertainty Dulls Investment,” explain why a rise in uncertainty affects investment spending.
c) (12 points) Assuming only U.S. interest rates were decreased in Fall 2008, how should net exports (EX - IM) have reacted to the drop in interest rates? Explain why.
d) (10 points) Explain why the total change in real GDP would be larger than the initial change in investment + the initial change in net exports.
Question 6 (10 points; 4 minutes)
According to the study by Chris Carroll et al cited in article #17a by Nick Bunker (“Wealth Inequality and the Marginal Propensity to Consume”) middle-income families have a larger mpc than do wealth families. In which case below would the multiplier be larger? Explain why.
• (Today) When the wealthy owners of consumer goods companies are paid 300 times as much as the typical worker in their companies, as is true today, or
• (50 years ago) When the wealthy owners of consumer goods companies are paid 20 times as much as the typical worker in their companies, as was true fifty years ago
Question 7 (15 points, 7 minutes)
San Franciscans who work at tech companies such as Google and Apple can ride to work for free on “tech shuttles” – large luxury busses that seat 120 people.
• Fans of the shuttles note that each 120-seat bus represents 120 fewer cars commuting on the freeways, decreasing pollution and traffic
• Opponents of the shuttles argue that the large busses allow tech workers to live far from the office, promoting gentrification.
Tech companies pay the entire cost of providing the shuttle. In addition, they also pay San Francisco a fee to operate in The City.
Instead of being charged fees, should the tech shuttles be subsidized by local government? Defend your answer, using economic language. State any necessary assumptions explicitly. Draw graph(s) as appropriate.
This is the second midterm from Prof. Olney's Fall 2014 offering of Economics 1. The exam was written as a 50 minute exam.
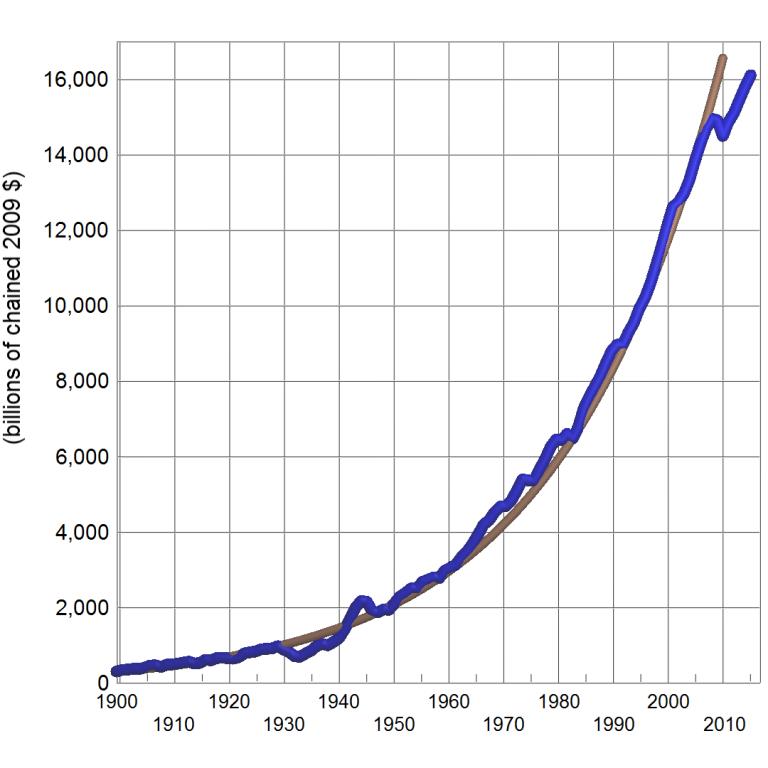
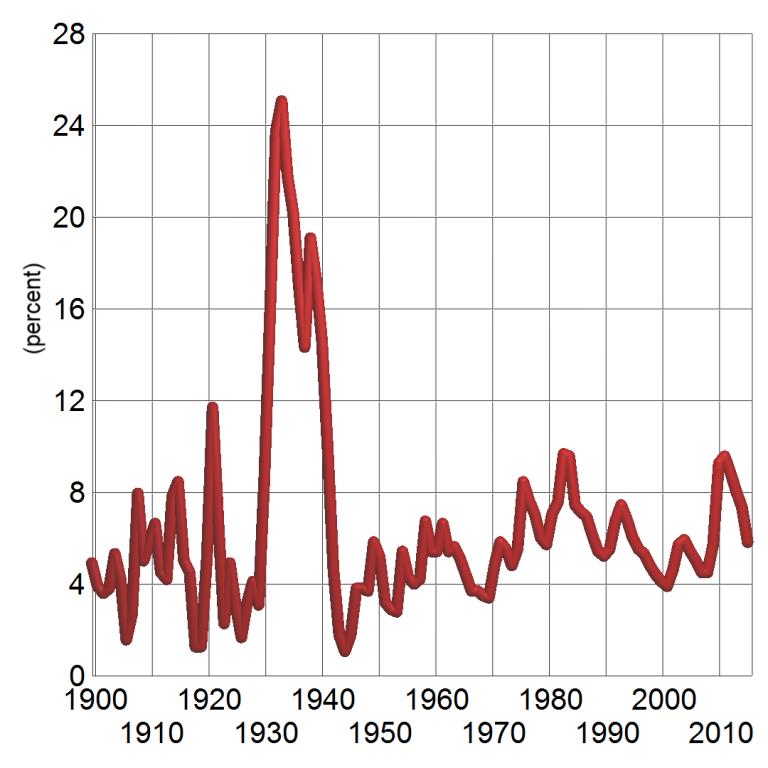
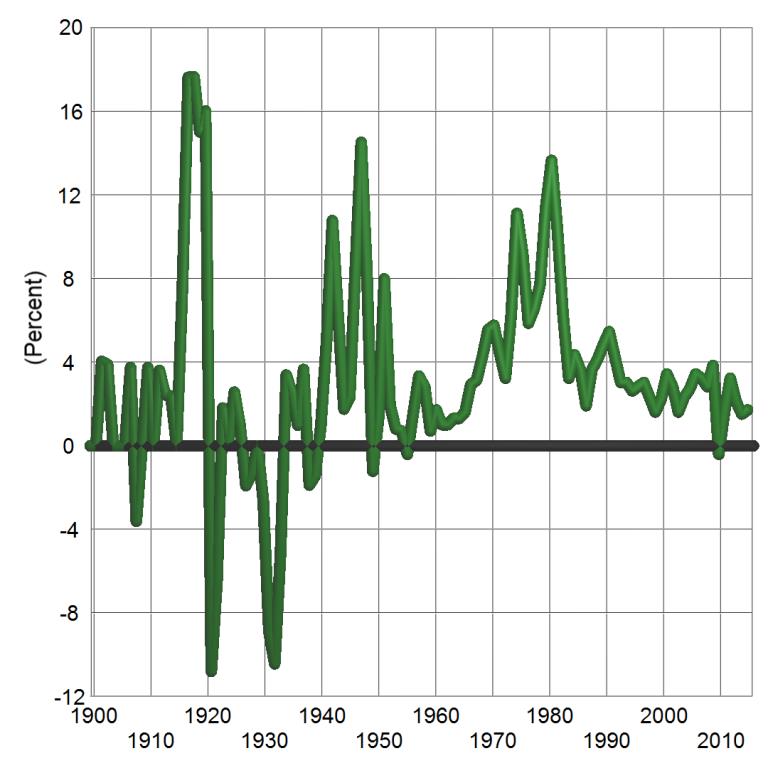
1. (15 points total; 7 minutes total; 5
points per graph) For each of the three graphs below,
provide (a) a title for the graph; (b) 1 sentence that describes
current values in historical perspective; (c) 1 sentence that
describes any pre-2007 feature of the graph.
2. (15 points total; 7 minutes total) Based on the reader articles #11a, “Striking it Richer: The Evolution of Top Incomes in the United States,” by Emmanuel Saez, and #11b.,“Treating Inequality with Redistribution: Is the Cure Worse than the Disease?,” by Jonathan D. Ostry and Andrew Berg, answer these questions.
a. (8 points) Describe any 2 aspects to the pattern of income inequality in the United States. Your answer should clearly indicate that you read and remembered the reader article.
b. (7 points) The article (blog entry) by Ostry & Berg is a summary of some of their research. According to their work, do redistribution policies lower economic growth? What are any two nuances in their results?
3. (25 points total; 11 minutes total). These quick questions are designed to take no more than 2 minutes each. Pace yourself! Don’t spend lots of time on any one question.
a. (5 points) Where is the following activity recorded in the U.S. GDP expenditure accounts? Defend your answer.
• A California bookseller sells $100 in new books produced in California to a professor who is a resident of Japan.
• A California lawyer bills a client from Seoul, South Korea $2,000 for legal services.
• A Berkeley restaurant sells a $20 pizza to a family visiting from Sweden.
b. (5 points) When Prof. Olney buys $800 worth of stock for her retirement fund, why isn’t that $800 purchase recorded as consumption expenditure in U.S. GDP accounts?
c. (5 points) Why do most people think the economy is still in bad shape when economists say “the economy is now in the recovery phase”?
d. (5 points) Are all Econ 1 students out of the labor force? Explain your answer.
e. (5 points) The CPI at the end of year 1 was 230. The CPI at the end of year 2 was 235. Set up (but don’t simplify) the equation that calculates the inflation rate.
4. (20 points total; 9 minutes total) Entire Foods is a grocery store in a monopolistically competitive industry.
a. (6 points) Entire Foods, like all grocery stores, is initially in long-run equilibrium. At the right, draw a graph that shows this initial condition. Use subscripts “1” to label your points, curves, and areas.
b. (5 points) Entire Foods changes its advertising campaign. Rather than advertise prices, its new motto is “Values Matter.” (It doesn’t spend any additional money; it just changes the focus.) The campaign works! Some customers leave their usual grocery store and start shopping at Entire Foods. Briefly explain why and how the successful ad campaign affects Entire Foods prices, quantity, and profit. On your graph, show these short-run effect. Use subscripts “2” to label your points, curves, and areas.
c. (5 points) What will happen in the grocery store industry in the long run? What will happen to Entire Foods prices, quantity, and profit in the long run? Why? No graph is necessary.
d. (4 points) Suppose instead that Entire Foods was a monopolist which implemented a successful advertising campaign. Would your answer to part (c) still be the same? Explain.
5. (10 points; 5 minutes)
As of October 25, health care workers returning to New York after assisting Ebola patients in West Africa must be quarantined for 21 days. When the quarantine policy was announced, NY Governor Cuomo said “It's too serious a situation to leave [avoiding contact with others] to the honor system of compliance.” But critics of the quarantine policy “worry that the new rules will discourage health care workers from volunteering to fight the Ebola epidemic in West Africa.” Is the quarantine the optimal policy? Reference both statements above and use economic concepts in your answer. No graph is necessary.
6. (15 points total; 7 minutes total)
Loans extended to homeowners who later defaulted (could not pay back the loans) was a key contributor to the Great Recession. Usually when a borrower defaults, the bank loses money. But banking rules in 2007 allowed banks to sell the loans to private investors, which meant the banks were not hurt when borrowers defaulted.
a. (6 points) When the banks offered to lend money to homeowners at very high interest rates, why did this create adverse selection problems? Be clear.
b. (6 points) When the banks were allowed to sell the loans to private investors, why did this create moral hazard problems? Be clear.
c. (3 points) Should the banking rules require the banks to have more “skin in the game” – that is, should the banking rules require that the banks risk losing money if the borrowers default? Defend your answer.