|
Introduction to Economics University of California, Berkeley Fall 2019 Professor Martha Olney |
Midterm #1 from previous terms
This is the first midterm from Prof. Olney's Fall 2019 offering of Economics 1.
The exam was written as a 50 minute exam but administered over 80 minutes.
Question 1 (10 points; 5 minutes)
When a neighborhood (such as the Mission in San Francisco) gentrifies, two things happen. [1] The incomes of people who live in a neighborhood rise sharply. [2] The rents that shops and restaurants pay also rise sharply. What effect does gentrification of a neighborhood have on prices and quantities of restaurant meals? In the space below, answer the question & defend your answer. Draw a graph that supports your answer.
Question 2 (8 points; 4 minutes)
In an effort to address rising rents, the City of Oakland changed its policies about 10 years ago to encourage more construction. The Uptown area of Oakland has seen a big increase in the number of apartment and condo buildings since the policy was changed. But over the same decade, rents in Oakland and in the Uptown area of Oakland have increased, a lot. Critics of the city say the increase in rent indicates the policy change failed to address rising rents. Supporters of the city say the critics have not formed the right counterfactual. Explain to the critics what “the right counterfactual” would be and why their criticism is ill-formed.
Question 3 (8 points; 4 minutes)
A tariff is simply a tax. In the case of a tariff, the tax is assessed on purchases of imported goods. Suppose a new tariff of 10 percent is imposed on imported goods. Suppose before the tariff, imports were $300 billion per year. If the tariff generates about $28 billion of tariff (tax) revenue per year for the government, what can you say about the tariff’s effectiveness in lowering quantity demanded? Draw a graph that supports your answer.
Question 4 (10 points; 5 minutes)
This question is from reader article #8, “Bart Fare Increase Isn’t a Done Deal,” by Rachel Swan, San Francisco Chronicle, June 4, 2019. Based on the three factors that affect price elasticity of demand, what would you argue are the likely short-run and long-run effects of an increase in Bart fares? The Bart Board’s goal is to maximize total revenue. In what case(s) should the Bart increase fares?
The Washington DC Metro system is very similar to Bart, but it has higher “peak” (commute time) and lower “off-peak” (mid-day, evenings, weekend) fares. If Bart implemented a similar peak versus off-peak fare system, how would having “peak” and “off-peak” times and fares impact your analysis?
Question 5 (10 points; 5 minutes)
A) (2 points) Suppose a city imposes rent control. In the graph at the right, p* is the market equilibrium monthly rent for a 1-bedroom apartment and pc is the rent controlled price. Using the graph, how many apartments will be rented per month at the rent-controlled price?
B) (1 points) What is the definition of consumer surplus?
C) (3 points) Suppose landlords ask for credit reports and rent (at the rent-controlled price PC) to the people with the highest willingness and ability to pay. On the graph, shade in the amount of consumer surplus that would be generated using vertical lines ||| to shade in the area. Briefly explain why you shaded it as you did.
D) (4 points) Suppose instead the apartments are rented at the rent-controlled price PC to the people with the lowest willingness and ability to pay. On the graph, shade in the amount of consumer surplus that would be generated using horizontal lines ≡ to shade in the area. Briefly explain why you shaded it as you did.
Question 6 (30 points total; 15 minutes total)
Consider the market for milk produced by dairy farmers in Wisconsin. The milk produced in Wisconsin is sold in both the US and Asia. Treat that as one market (the market for milk produced in Wisconsin). Assume the Wisconsin milk market is perfectly competitive, the dairy farmers are profit maximizers, and the market was initially in long-run competitive equilibrium.
A. (8 points) Draw the graphs below for the milk market and the typical Wisconsin dairy farmer, showing the initial long run competitive equilibrium. Use subscripts "1" on your labels.
B. (8 points) As a result of the trade war, Asian demand for Wisconsin milk has decreased. Show the effects on your graph above, using subscripts “S” or “SR” or “2" on your labels. (Help yourself and your GSI by using a different color or dashes for your curves in this part.) Summarize your graph by noting below the SHORT RUN effect (increase, decrease, no change) of the drop in demand on the price of milk, on the typical quantity of milk sold by an individual Wisconsin dairy farmer, on the typical profit of a Wisconsin dairy farmer, and on the market quantity of milk sold by Wisconsin dairy farmers. For each answer, provide a one sentence defense.
C. (8 points) Now show the LONG RUN effects on your graph above, using subscripts “L” or “LR” or “3" on your labels. Relative to the effects in part b, what are the LONG RUN effects of the drop in Asian demand on price, quantity of milk sold by a typical Wisconsin dairy farmer, profit of a typical Wisconsin dairy farmer, the number of Wisconsin dairy farmers, and market quantity of milk sold by Wisconsin dairy farmers? For each answer, provide a one sentence defense.
D. (6 points) Thinking about dairy farming, what is the difference between “exiting” the industry and “shutting down”? Under what circumstances would a dairy farmer shut down?
Question 7 (24 points total; 12 minutes total)
There are two products that can be produced in the economy: shelter and high tech. “Shelter” includes any place you can live: houses or apartments, owner-occupied or rented. “High tech” includes all the products we associate with Silicon Valley – high tech, internet, social media, and so on. Land can be used to produce shelter, or it can be used to produce high tech. But any particular parcel of land can not be used to produce both shelter and high tech.
There are two areas in the economy: the Central Valley (CV) and the Silicon Valley (SV). The Central Valley (CV) has the comparative advantage in the production of shelter. The Silicon Valley has the comparative advantage in the production of high tech.
A) (6 points) Draw a production possibilities frontier for the CV. Label your axes. In the space below, explain why a PPF is usually non-linear. Note: Simply writing down the name of a concept is not what it means to "explain" something.
B) (6 points) Who has the lower opportunity cost of producing shelter, CV or SV? In general (so, you need not know anything about CV or SV to answer), what might give one area a lower opportunity cost of producing shelter? Explain.
C) (6 points) If CV and SV decide to specialize and trade, which area will produce shelter? Which area will produce high tech? What does it mean to say there will be “gains from trade”?
D) (6 points) It takes about two hours to commute from CV to SV. Do you think it is good for CV and SV to specialize and trade? Why or why not?
The exam was written as a 50 minute exam but administered over 80 minutes.
Question 1 (16 points total; 8 minutes total)
Chris and Robin are a married couple. They both use pronouns
“they/them/theirs.” Both Chris and Robin are able to produce two
goods: home production (meals, laundry, housekeeping, child
raising) and market production (working for a wage).
A. (4 points) Suppose Chris and Robin wish to maximize the total quantity of home production and market production that they can collectively produce. They are considering specializing (one person focuses on home production, the other on market production) and trading (sharing with each other). What is one condition under which specialization and trade will NOT increase total production for this couple? Defend your answer.
B. (6 points) Consider Chris-and-Robin (C&R) as one economy, producing two goods: home production and market production. Draw a PPF for the C&R economy, placing home production on the vertical axis and market production on the horizontal axis. Label this PPF as PPF1.
Chris-and-Robin have a new baby! They have not had a full night’s sleep since the baby was born. The lack of sleep has decreased their productivity, a lot. Show the effect of the lack of sleep on the PPF, using label PPF2. Explain why you drew PPF2 as you did.
C. (6 points) Hooray for Mom! Mom (grandma!) arrives for a four-week visit to help with home production. Explain why Mom’s visit allows C&R to increase their consumption of home and market production beyond the PPF you drew in part b. (No graph required in part c.)
Question 2 (9 points; 4.5 minutes) What are “marginal returns”? What does it mean for marginal returns to “diminish”? Why do marginal returns diminish?
 Question 3 (8 points, 4 minutes)
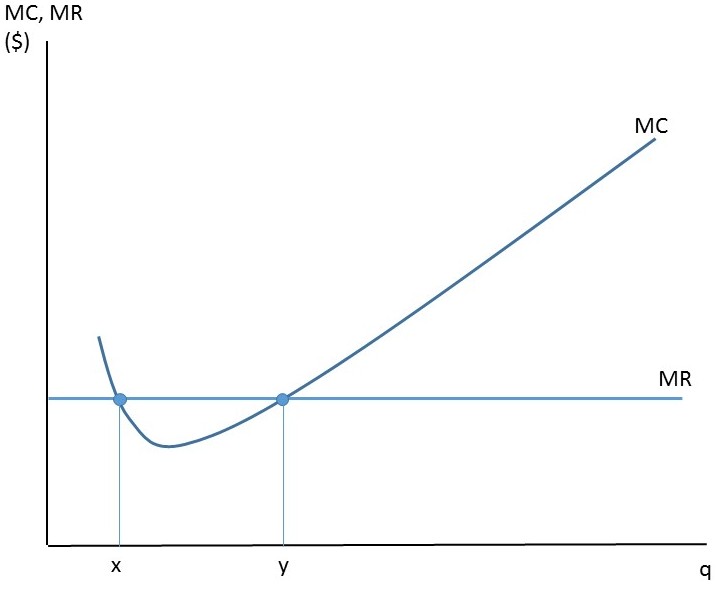
Consider the graph at the right. Are both X and Y
profit-maximizing quantities? Defend your answer.
Question 3 (8 points, 4 minutes)
Consider the graph at the right. Are both X and Y
profit-maximizing quantities? Defend your answer.
Question 4 (10 points; 5 minutes)
Consider wine produced from grapes grown in California (“California wine”). Some California wine is sold primarily in China. Other California wine is sold primarily in the United States. As of last Sunday, China charges a 79 % tariff (tax) on California wine sold in China.
In the short run, what effects do you expect the new Chinese tariff on California wine will have on the market equilibrium price and market equilibrium quantity of California wine sold in the United States? Explain why. Supplement your answer with a graph of the market for California wine sold in the U.S.
Question 5 (16 points total; 8 minutes total) This question relies on article #6a, “In Praise of Price Gouging,” by John Stossel (September 7, 2005).
A. ( 8 points) Stossel begins with a (hypothetical) story of someone paying $20 for a bottle of water. Use a supply and demand graph to illustrate how the equilibrium price of a bottle of water might have risen, post-Hurricane Katrina in New Orleans, from $1 to $20 a bottle. Use subscripts “1" for the pre-hurricane period and subscripts “2" for the post-hurricane period.
Now suppose New Orleans has an anti-price-gouging law in place, preventing price of water from rising above $2 per bottle after a natural disaster. Show the effects of the anti-price-gouging law on your graph using subscripts “3.”
B. (4 points) Explain why you showed the effect of the anti-price-gouging law as you did.
C. (4 points) Laws against price gouging in the wake of a natural disaster might create a market disequilibrium. What is a non-price mechanism that could be used to allocate bottles of water following a hurricane? Will your non-price mechanism ensure that water goes to the people who really need it? Explain.
Question 6 (9 points, 4.5 minutes) You work for a grocer who accidentally bought an extra 1,000 pounds of onions. The grocer has paid the onion farmer and can not return the extra onions. The goal now is to maximize revenue from selling onions. The usual price for onions is 59 cents per pound. Should the grocer increase the price above 59 cents, or lower the price below 59 cents in order to maximize revenue? Defend your answer. If you need to make any assumptions, do so explicitly (that is, write the assumption(s) down, don’t just keep them locked in your brain).
Question 7 (32 points total; 16 minutes total) Consider the U.S. market for plastic toys manufactured in China. The toys are sold in U.S. stores (“the sellers”) and bought by U.S. consumers (“the buyers”). Assume this market is perfectly competitive.
A. (8 points) Draw the graphs below for the U.S. market and the typical U.S. seller of Chinese-manufactured plastic toys, showing the initial long run competitive equilibrium. Use subscripts "1" on your labels.
B. (8 points) The United States government imposes a tariff (tax) on Chinese manufactured toys. Assume the tariff is a constant dollar amount per toy and is remitted to the government by the U.S. seller. Show the effects on your graph above, using subscripts “S” or “SR” on your labels. (Help yourself and your GSI by using a different color or dashes for your curves in this part.) Summarize your graph by noting the SHORT RUN effect of the new tariff (increase, decrease, no change) on the price of Chinese-manufactured toys sold in the U.S., on the typical number of Chinese-manufactured toys sold by a U.S. seller, on the typical profit of a seller, and on the market quantity of Chinese-manufactured toys sold in the U.S. For each answer, provide a one sentence defense.
C. (8 points) Now show the LONG RUN effects on your graph above, using subscripts “L” or “LR” on your labels. Relative to the effects in part b, what are the LONG RUN effects of the new tariff on price, quantity of Chinese-manufactured toys sold by a typical seller, profit of a typical seller, the number of sellers, and market quantity of Chinese-manufactured toys sold? For each answer , provide a one sentence defense.
D. (8 points) Who bears the greater burden of the new tariff (tax) in the short run? Who bears the burden of the tax in the long run? Defend your answers. If you need to make any assumptions, do so explicitly (that is, write the assumption(s) down, don’t keep them locked in your brain).
A. (4 points) Suppose Chris and Robin wish to maximize the total quantity of home production and market production that they can collectively produce. They are considering specializing (one person focuses on home production, the other on market production) and trading (sharing with each other). What is one condition under which specialization and trade will NOT increase total production for this couple? Defend your answer.
B. (6 points) Consider Chris-and-Robin (C&R) as one economy, producing two goods: home production and market production. Draw a PPF for the C&R economy, placing home production on the vertical axis and market production on the horizontal axis. Label this PPF as PPF1.
Chris-and-Robin have a new baby! They have not had a full night’s sleep since the baby was born. The lack of sleep has decreased their productivity, a lot. Show the effect of the lack of sleep on the PPF, using label PPF2. Explain why you drew PPF2 as you did.
C. (6 points) Hooray for Mom! Mom (grandma!) arrives for a four-week visit to help with home production. Explain why Mom’s visit allows C&R to increase their consumption of home and market production beyond the PPF you drew in part b. (No graph required in part c.)
Question 2 (9 points; 4.5 minutes) What are “marginal returns”? What does it mean for marginal returns to “diminish”? Why do marginal returns diminish?
Question 3 (8 points, 4 minutes)
Consider the graph at the right. Are both X and Y
profit-maximizing quantities? Defend your answer.Question 4 (10 points; 5 minutes)
Consider wine produced from grapes grown in California (“California wine”). Some California wine is sold primarily in China. Other California wine is sold primarily in the United States. As of last Sunday, China charges a 79 % tariff (tax) on California wine sold in China.
In the short run, what effects do you expect the new Chinese tariff on California wine will have on the market equilibrium price and market equilibrium quantity of California wine sold in the United States? Explain why. Supplement your answer with a graph of the market for California wine sold in the U.S.
Question 5 (16 points total; 8 minutes total) This question relies on article #6a, “In Praise of Price Gouging,” by John Stossel (September 7, 2005).
A. ( 8 points) Stossel begins with a (hypothetical) story of someone paying $20 for a bottle of water. Use a supply and demand graph to illustrate how the equilibrium price of a bottle of water might have risen, post-Hurricane Katrina in New Orleans, from $1 to $20 a bottle. Use subscripts “1" for the pre-hurricane period and subscripts “2" for the post-hurricane period.
Now suppose New Orleans has an anti-price-gouging law in place, preventing price of water from rising above $2 per bottle after a natural disaster. Show the effects of the anti-price-gouging law on your graph using subscripts “3.”
B. (4 points) Explain why you showed the effect of the anti-price-gouging law as you did.
C. (4 points) Laws against price gouging in the wake of a natural disaster might create a market disequilibrium. What is a non-price mechanism that could be used to allocate bottles of water following a hurricane? Will your non-price mechanism ensure that water goes to the people who really need it? Explain.
Question 6 (9 points, 4.5 minutes) You work for a grocer who accidentally bought an extra 1,000 pounds of onions. The grocer has paid the onion farmer and can not return the extra onions. The goal now is to maximize revenue from selling onions. The usual price for onions is 59 cents per pound. Should the grocer increase the price above 59 cents, or lower the price below 59 cents in order to maximize revenue? Defend your answer. If you need to make any assumptions, do so explicitly (that is, write the assumption(s) down, don’t just keep them locked in your brain).
Question 7 (32 points total; 16 minutes total) Consider the U.S. market for plastic toys manufactured in China. The toys are sold in U.S. stores (“the sellers”) and bought by U.S. consumers (“the buyers”). Assume this market is perfectly competitive.
A. (8 points) Draw the graphs below for the U.S. market and the typical U.S. seller of Chinese-manufactured plastic toys, showing the initial long run competitive equilibrium. Use subscripts "1" on your labels.
B. (8 points) The United States government imposes a tariff (tax) on Chinese manufactured toys. Assume the tariff is a constant dollar amount per toy and is remitted to the government by the U.S. seller. Show the effects on your graph above, using subscripts “S” or “SR” on your labels. (Help yourself and your GSI by using a different color or dashes for your curves in this part.) Summarize your graph by noting the SHORT RUN effect of the new tariff (increase, decrease, no change) on the price of Chinese-manufactured toys sold in the U.S., on the typical number of Chinese-manufactured toys sold by a U.S. seller, on the typical profit of a seller, and on the market quantity of Chinese-manufactured toys sold in the U.S. For each answer, provide a one sentence defense.
| Effect on quantity sold by the typical
seller |
Effect on profit of the typical seller |
| Effect on market quantity |
Effect on price of Chinese-manufactured
toy |
C. (8 points) Now show the LONG RUN effects on your graph above, using subscripts “L” or “LR” on your labels. Relative to the effects in part b, what are the LONG RUN effects of the new tariff on price, quantity of Chinese-manufactured toys sold by a typical seller, profit of a typical seller, the number of sellers, and market quantity of Chinese-manufactured toys sold? For each answer , provide a one sentence defense.
| Effect on the number of sellers |
Effect on market price | Effect on market quantity |
| Effect on typical seller quantity |
Effect on typical seller profit |
D. (8 points) Who bears the greater burden of the new tariff (tax) in the short run? Who bears the burden of the tax in the long run? Defend your answers. If you need to make any assumptions, do so explicitly (that is, write the assumption(s) down, don’t keep them locked in your brain).
This is the first midterm from Prof. Olney's Fall 2017 offering of Economics 1.
The exam was written as a 50 minute exam but administered over 80 minutes.
Question 1 (18 points; 9 minutes) In 2009, the
European Union (EU) purchased 30,000 tons of butter from
European dairy farmers in order to maintain a minimum price that
the EU had established for butter.
A) (6 points) Draw a graph of the short-run 2009 butter market in the EU. Show the market equilibrium price as p*, and the minimum price the government established as pm. Show the market equilibrium quantity as q*, the quantity sold by farmers as qf, and the quantity sold to consumers as qc.
B) (6 points) In the absence of the EU's purchase, the butter market would have been in equilibrium. What was the effect of the EU's purchase on consumer surplus in the butter market? Explain your answer.
C) (6 points) On the graph you drew in part (a), show the producer surplus if the market had reached equilibrium by shading the appropriate area of the graph with vertical hash marks |||. Show the producer surplus with the EU's purchase by shading the appropriate area of the graph with horizontal lines ≡. Explain why the EU's purchase of butter changed producer surplus.
Question 2 (10 points; 5 minutes) This question is based on article #8, "How Chicken Wings Explain Metro's Looming Ridership Problems," by Powers (2017). The Metro in DC is very similar to our Bart system, with the fare dependent upon the distance traveled. The one difference between the two systems is that the Metro charges higher fares during commute time than it does during "off-peak" time.
Based on the factors that affect price elasticity of demand, what are the likely short-run and long-run effects on total revenue of an increase in DC Metro fares? In your answer, distinguish between the effects of increasing fares during commute time and during "off-peak" times.
Question 3 (25 points; 13 minutes) The U.S. Virgin Islands (USVI) is a U.S. territory in the Caribbean. It produces two outputs: tourism and rum. Rum can be made from sugarcane, which grows in the islands.
A) (6 points) Draw a PPF for USVI, putting tourism on the vertical axis and rum on the horizontal axis. Label your PPF as "PPF1." Explain why you drew your PPF with that particular slope and shape.
B) (6 points) USVI acquires new seaports that accommodate large cruise ships carrying thousands of tourists. What effect do the new ports have on USVI's PPF? Why? Show the effect on your graph, using labels with subscripts "2."
C) (5 points) USVI pursues the gains from trade. USVI trades with the mainland. Rum can be manufactured anywhere. USVI has the comparative advantage in tourism. For many years, demand for tourism is quite high and USVI is operating on its PPF. On your PPF drawn above, draw in a point and label it "C" to indicate where USVI produces. Below, defend your choice.
D) (8 points) Hurricanes Irma and Maria destroyed the beautiful sandy beaches and beachfront properties that drew many tourists to USVI. Tourists stop coming to USVI. Without outside aid, can USVI quickly go back to the standard of living it had before the hurricanes? Would your answer be different if USVI had not pursued the gains from trade? Explain your answers.
Question 4 (19 points; 10 minutes)
You are an economist who is asked by the UCB administration to analyze whether the $800,000 security expenditure on Sunday September 24 was a good idea. You tell the administration you first need to know three things
1. their goal
2. the counterfactual
3. the opportunity cost of the funds
A) (10 points) Separately for each of these three items, explain why you need that piece of information (the goal, the counterfactual, the opportunity cost) in order to provide your analysis.
B) (9 points) Think about the four causes of disagreement discussed in article #1 by Fritz Machlup, "Why Economists Disagree," published in 1965. For each of these 3 items (goal, counterfactual, opportunity cost), what is a possible cause of disagreement? Defend your answers.
Question 5 (28 points; 14 minutes)
Consider the market facilitated by Airbnb: the market for renting rooms by the night in houses and apartments
• Sellers are called "hosts." They offer a room for rent. Hosts can be homeowners or apartment leaseholders.
• Buyers are called "guests." They pay hosts in order to rent a room for 1 night or more in a house or apartment
• The price is the nightly rent. The quantity in the market is “room-nights” which is the sum of the number of nights each room is rented, summed over all hosts.
A) (4 points) If the typical economic profit earned by a host is 0, will anyone want to be a host? Explain.
B) (8 points) Assume the market for rented rooms is perfectly competitive and is initially in long run competitive equilibrium. Draw the relevant graphs below for the market and for the typical host. Use subscripts "1" on your labels.
C) (8 points) There is a change: The City of San Francisco now requires all Airbnb hosts to pay a $125 fee to the City each year. The fee must be paid regardless of the number of room-nights sold. What is the SHORT RUN effect of the new city fee on the price of a rented room in a house or apartment? On the typical number of room-nights sold by a host? On the typical profit of a host? On the market quantity of room-nights sold? For each answer (increase, decrease, no change), provide a one sentence defense. Show the effects on your graph above, using subscripts "2" on your labels. (Help yourself and your GSI by using a different color or dashes for your curves in this part.)
D) (8 points) Relative to the short run effects in part c, what are the LONG RUN effects of the new city fee on price, room-nights sold by a typical host, profit of a typical host, the number of hosts, and market quantity of room nights sold? For each answer (increase, decrease, no change), provide a one sentence defense. Show the effects on your graph above, using subscripts "3" on your labels.
This is the first midterm from Prof. Olney's Fall 2016 offering of Economics 1. The exam was written as a 50 minute exam but administered over 80 minutes.
Question 1 (22 points, 11 minutes) Let's
consider two parts of California as two separate economies: the
Central Valley and Silicon Valley. Suppose these economies
produce two products: agricultural products and industrial
products (including high tech and aerospace).
a. (8 points) Initially the two economies each produce a mix of both goods: agricultural products (A) and industrial products (I). Illustrate the production possibilities of the Central Valley economy. Explain why the PPF has the shape it does.
b. (7 points) The Central Valley has fertile land and extensive irrigation systems delivering water to farms. When the irrigation system was installed, it vastly increased agricultural productivity. The Silicon Valley is near two major universities whose graduates are some of the best tech and data scientists in the country. The tech and data scientists are constantly inventing new products and more efficient ways to produce high tech and aerospace goods.
Over time everyone recognizes that the Central Valley has a comparative advantage in the production of agricultural products. Explain why the many fruit trees that once grew in the Silicon Valley no longer exist.
c. (7 points) Which economy -- Central Valley or Silicon Valley -- will grow faster over time? Defend your answer.
Question 2 (10 points, 5 minutes) One candidate says: “The crime rate fell after a particular policing policy was implemented, which is evidence that the policing policy was successful.” The other candidate says: “Wrong.” What is a proper way to evaluate whether the policy was successful?
Question 3 (10 points, 5 minutes) Drawing on the article #5, “How Scalpers Make Their Millions with ‘Hamilton’,” sketch a model of supply and demand that shows why the price of scalped tickets for the July 9 performance was so much greater than it had been in May. Identify the forces that shifted demand and those that shifted supply. In your answer, include enough detail from the article that we know you read the article. (If you didn’t read the article and you try to make stuff up, you’ll earn fewer points than if you are honest and say “I didn’t read it.”)
Question 4 (36 points, 18 minutes) Suppose that pizza is sold in a perfectly competitive market
a. (8 points) Initially, the pizza industry is in long-run competitive equilibrium. Draw the relevant graphs below for the market and for the typical firm. Use subscripts “1” on your labels.
b. (10 points) A new tax on pizza is implemented: $2 per pizza that must be paid to the city. In the short run, what happens to the price of pizza? To the market quantity? To the quantity produced by the typical firm? To the profit of the typical firm? Show the effects on your graph above, using subscripts “2” on your labels. (Help yourself and your GSI by using a different color or dashes for your curves in this part.)
c. (10 points) In the short run, who will bear the greater burden of the tax: buyers or sellers? Defend your answer.
d. (8 points) In the long run, what happens in the pizza industry? Specify the effects on market price, market quantity, typical firm quantity, typical firm profit, and the number of firms. Show the effects on your graph above, using subscripts “3” on your labels.
Question 5 (10 points, 5 minutes) Suppose that sellers could determine every individual buyer's willingness & ability to pay for a product, and then charged each individual that price. If you're willing and able to pay $10, you're charged $10. If I'm willing and able to pay $2.25, I'm charged $2.25. What can you say about the total consumer surplus in that market?
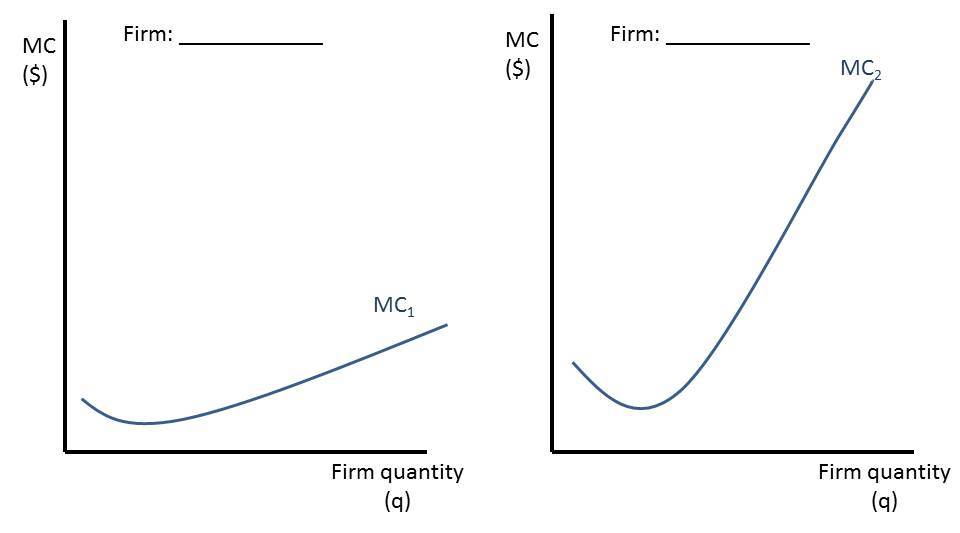
Question 6 (12 points, 6 minutes) Compare two manufacturing firms. One, Spacious Firm (SF) has a 10,000 square foot building with lots of machines. The machines are arranged efficiently so that when additional workers are brought into Spacious Firm, the workers can start producing output right away. The other, Crowded Firm (CF) has a 2,000 square foot building with the same number of machines as Spacious Firm. The machines are crowded onto the factory floor in a haphazard way. When additional workers are brought into Crowded Firm, all workers are bumping into each other and the total output of Crowded Firm only rises a small amount.
Label each of the marginal cost curves below with a label – SF or CF – to indicate which MC curve best describes which firm. Explain your answer. Your explanation should include the concept of “diminishing marginal returns.”
a. (8 points) Initially the two economies each produce a mix of both goods: agricultural products (A) and industrial products (I). Illustrate the production possibilities of the Central Valley economy. Explain why the PPF has the shape it does.
b. (7 points) The Central Valley has fertile land and extensive irrigation systems delivering water to farms. When the irrigation system was installed, it vastly increased agricultural productivity. The Silicon Valley is near two major universities whose graduates are some of the best tech and data scientists in the country. The tech and data scientists are constantly inventing new products and more efficient ways to produce high tech and aerospace goods.
Over time everyone recognizes that the Central Valley has a comparative advantage in the production of agricultural products. Explain why the many fruit trees that once grew in the Silicon Valley no longer exist.
c. (7 points) Which economy -- Central Valley or Silicon Valley -- will grow faster over time? Defend your answer.
Question 2 (10 points, 5 minutes) One candidate says: “The crime rate fell after a particular policing policy was implemented, which is evidence that the policing policy was successful.” The other candidate says: “Wrong.” What is a proper way to evaluate whether the policy was successful?
Question 3 (10 points, 5 minutes) Drawing on the article #5, “How Scalpers Make Their Millions with ‘Hamilton’,” sketch a model of supply and demand that shows why the price of scalped tickets for the July 9 performance was so much greater than it had been in May. Identify the forces that shifted demand and those that shifted supply. In your answer, include enough detail from the article that we know you read the article. (If you didn’t read the article and you try to make stuff up, you’ll earn fewer points than if you are honest and say “I didn’t read it.”)
Question 4 (36 points, 18 minutes) Suppose that pizza is sold in a perfectly competitive market
a. (8 points) Initially, the pizza industry is in long-run competitive equilibrium. Draw the relevant graphs below for the market and for the typical firm. Use subscripts “1” on your labels.
b. (10 points) A new tax on pizza is implemented: $2 per pizza that must be paid to the city. In the short run, what happens to the price of pizza? To the market quantity? To the quantity produced by the typical firm? To the profit of the typical firm? Show the effects on your graph above, using subscripts “2” on your labels. (Help yourself and your GSI by using a different color or dashes for your curves in this part.)
c. (10 points) In the short run, who will bear the greater burden of the tax: buyers or sellers? Defend your answer.
d. (8 points) In the long run, what happens in the pizza industry? Specify the effects on market price, market quantity, typical firm quantity, typical firm profit, and the number of firms. Show the effects on your graph above, using subscripts “3” on your labels.
Question 5 (10 points, 5 minutes) Suppose that sellers could determine every individual buyer's willingness & ability to pay for a product, and then charged each individual that price. If you're willing and able to pay $10, you're charged $10. If I'm willing and able to pay $2.25, I'm charged $2.25. What can you say about the total consumer surplus in that market?
Question 6 (12 points, 6 minutes) Compare two manufacturing firms. One, Spacious Firm (SF) has a 10,000 square foot building with lots of machines. The machines are arranged efficiently so that when additional workers are brought into Spacious Firm, the workers can start producing output right away. The other, Crowded Firm (CF) has a 2,000 square foot building with the same number of machines as Spacious Firm. The machines are crowded onto the factory floor in a haphazard way. When additional workers are brought into Crowded Firm, all workers are bumping into each other and the total output of Crowded Firm only rises a small amount.
Label each of the marginal cost curves below with a label – SF or CF – to indicate which MC curve best describes which firm. Explain your answer. Your explanation should include the concept of “diminishing marginal returns.”
This is the first midterm from Prof. Olney's Fall 2015 offering of Economics 1. The exam was written as a 50 minute exam.
Question 1 (20 points total; 9 minutes total)
Many tourists climb Mt Fuji in Japan, which is one of the world’s highest mountains: over 12,000 feet or 3,700 meters tall. Tourists can purchase water along the route at huts. The higher a tourist climbs up the mountain, the higher is the price of 1 liter of water. So a tourist pays more for 1 liter of water at the 10,000' hut than at the 7,000' hut. Assume water sellers on Mt. Fuji are profit-maximizers. And (even though it’s unrealistic) assume perfect competition.
a. (5 points) Water sold at huts is carried up the mountain by workers, not by vehicles. Referring to the costs of production, explain why sellers would charge a higher price for 1 liter of water at a higher elevation.
b. (5 points) Most tourists bring their own water, but drink it all before reaching the peak. Referring to the demand for water, explain why sellers would charge a higher price for 1 liter of water at a higher elevation.
c. (10 points) We learn that more water is sold at higher elevations than at lower elevations. Does that information help you determine whether differences in supply or differences in demand are primarily responsible for the price differences? Explain. Supplement your answer with a graph.
Question 2 (10 points; 4 minutes) Royal Dutch Shell is a profit-maximizing company that produces and sells oil. Last week, Shell announced it would immediately stop all offshore oil drilling in the Arctic, even though it had already spent $7 billion on the project. They stated that oil prices were expected to remain low and future drilling costs were expected to rise. Using economic terminology, explain Shell’s decision to immediately stop Arctic drilling. In your answer, be sure to indicate whether the $7 billion already spent on the project is relevant to their decision.
Question 3 (40 points; 18 minutes total)
In Oregon, farms can grow apples or grapes. Grapes are used to make wine. There are hundreds of small farms growing grapes and producing wine. Assume the Oregon wine industry is perfectly competitive.
a. (8 points) Initially, the Oregon wine industry was in long-run competitive equilibrium. Draw the relevant graphs below for the market and for the typical firm. Use subscripts “1” on your labels.
b. (12 points) Oregon wine becomes much more popular with consumers. In the short run, what happens to the price of Oregon wine? To the market quantity? To the quantity produced by the typical firm? To the profit of the typical firm? Show the effects on your graph above, using subscripts “2” on your labels.
c. (8 points) In the long run, what happens in the Oregon wine industry? Specify the effects on market price, market quantity, typical firm quantity, typical firm profit, and the number of firms. Show the effects on your graph above, using subscripts “3” on your labels.
d. (6 points) You can see the effect of the increased popularity of Oregon wine as you drive through Oregon: acres and acres of apple trees have been torn out, replaced with acres and acres of grape vineyards. Each time 10 acres of Oregon land is converted from apple orchards to grape vineyards, does Oregon’s production of apples fall by the same amount? Explain.
e. (6 points) Draw Oregon’s PPF (the two outputs are apples and grapes). Illustrate two things in one graph:
• your answer to part (c), the long-run adjustment
• your answer to part (d), the effect on apple production of converting apple orchards to vineyards
Briefly explain your graph.
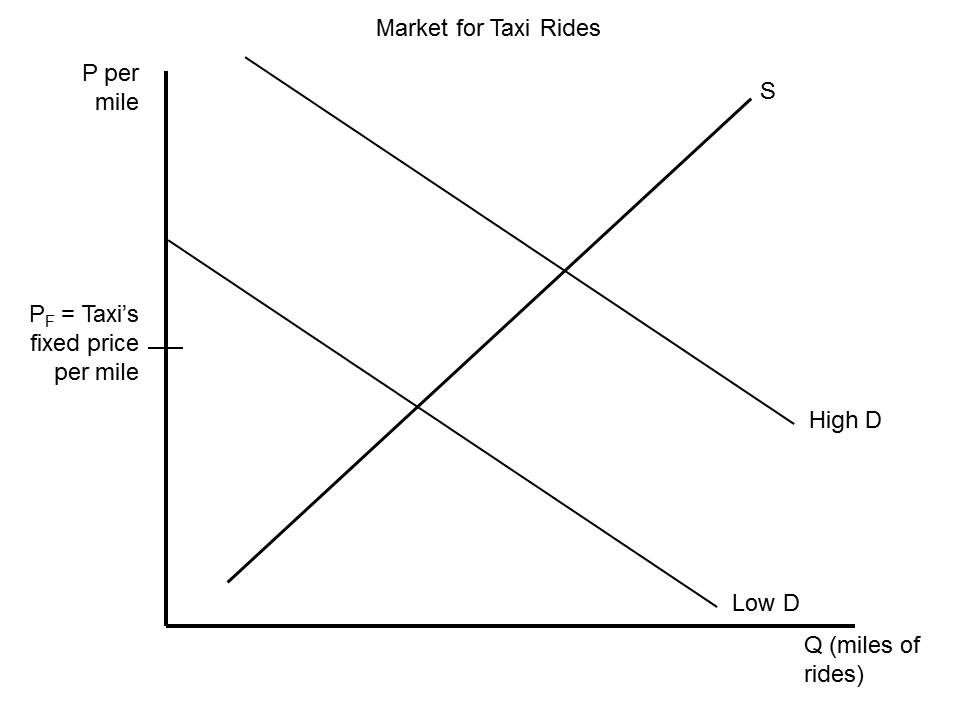
Question 4 (30 points; 13 minutes) This question draws on the three reader articles (#9a, 9b, 9c) about Uber.
a. (10 points) Taxi rides are sold at a fixed price. The price does not fall or rise in response to changes in demand. The graph at the right illustrates this market. When is the fixed price a price ceiling: when demand is low or when demand is high? When demand is high, will taxi rides go only to the people with the highest ability and willingness to pay? Explain.
b. (10 points) What is Uber’s “surge pricing”? Use the model of supply and demand to illustrate at right the market for Uber rides. In your graph, distinguish between a low-demand time and a high-demand time.
c. (10 points) When demand is high, is Uber price-gouging? In your answer, distinguish between a high-demand time such as Halloween or New Year’s Eve and a high-demand time such as an unexpected closure of all public transit (Bart, bus, etc.).
Many tourists climb Mt Fuji in Japan, which is one of the world’s highest mountains: over 12,000 feet or 3,700 meters tall. Tourists can purchase water along the route at huts. The higher a tourist climbs up the mountain, the higher is the price of 1 liter of water. So a tourist pays more for 1 liter of water at the 10,000' hut than at the 7,000' hut. Assume water sellers on Mt. Fuji are profit-maximizers. And (even though it’s unrealistic) assume perfect competition.
a. (5 points) Water sold at huts is carried up the mountain by workers, not by vehicles. Referring to the costs of production, explain why sellers would charge a higher price for 1 liter of water at a higher elevation.
b. (5 points) Most tourists bring their own water, but drink it all before reaching the peak. Referring to the demand for water, explain why sellers would charge a higher price for 1 liter of water at a higher elevation.
c. (10 points) We learn that more water is sold at higher elevations than at lower elevations. Does that information help you determine whether differences in supply or differences in demand are primarily responsible for the price differences? Explain. Supplement your answer with a graph.
Question 2 (10 points; 4 minutes) Royal Dutch Shell is a profit-maximizing company that produces and sells oil. Last week, Shell announced it would immediately stop all offshore oil drilling in the Arctic, even though it had already spent $7 billion on the project. They stated that oil prices were expected to remain low and future drilling costs were expected to rise. Using economic terminology, explain Shell’s decision to immediately stop Arctic drilling. In your answer, be sure to indicate whether the $7 billion already spent on the project is relevant to their decision.
Question 3 (40 points; 18 minutes total)
In Oregon, farms can grow apples or grapes. Grapes are used to make wine. There are hundreds of small farms growing grapes and producing wine. Assume the Oregon wine industry is perfectly competitive.
a. (8 points) Initially, the Oregon wine industry was in long-run competitive equilibrium. Draw the relevant graphs below for the market and for the typical firm. Use subscripts “1” on your labels.
b. (12 points) Oregon wine becomes much more popular with consumers. In the short run, what happens to the price of Oregon wine? To the market quantity? To the quantity produced by the typical firm? To the profit of the typical firm? Show the effects on your graph above, using subscripts “2” on your labels.
c. (8 points) In the long run, what happens in the Oregon wine industry? Specify the effects on market price, market quantity, typical firm quantity, typical firm profit, and the number of firms. Show the effects on your graph above, using subscripts “3” on your labels.
d. (6 points) You can see the effect of the increased popularity of Oregon wine as you drive through Oregon: acres and acres of apple trees have been torn out, replaced with acres and acres of grape vineyards. Each time 10 acres of Oregon land is converted from apple orchards to grape vineyards, does Oregon’s production of apples fall by the same amount? Explain.
e. (6 points) Draw Oregon’s PPF (the two outputs are apples and grapes). Illustrate two things in one graph:
• your answer to part (c), the long-run adjustment
• your answer to part (d), the effect on apple production of converting apple orchards to vineyards
Briefly explain your graph.
Question 4 (30 points; 13 minutes) This question draws on the three reader articles (#9a, 9b, 9c) about Uber.
a. (10 points) Taxi rides are sold at a fixed price. The price does not fall or rise in response to changes in demand. The graph at the right illustrates this market. When is the fixed price a price ceiling: when demand is low or when demand is high? When demand is high, will taxi rides go only to the people with the highest ability and willingness to pay? Explain.
b. (10 points) What is Uber’s “surge pricing”? Use the model of supply and demand to illustrate at right the market for Uber rides. In your graph, distinguish between a low-demand time and a high-demand time.
c. (10 points) When demand is high, is Uber price-gouging? In your answer, distinguish between a high-demand time such as Halloween or New Year’s Eve and a high-demand time such as an unexpected closure of all public transit (Bart, bus, etc.).