Midterm #2 from previous terms
This is the second midterm from Prof. Olney's Fall 2019 offering of Economics 1.
It followed the PGE power outages of October 2019 and was titled "The Outage Exam."
The exam was written as a 50 minute exam but administered over 80 minutes.
Question 1 (15 points total; 8 minutes total)
PGE is a profit-maximizing monopoly that sells electricity in Northern California. The marginal cost of delivering additional kilo-watt hours (kwh) of electricity is low and constant over a very large range as depicted in the graph at the right. But delivering electricity to homes and businesses requires tremendously high fixed costs.
A. (10 points) Using the graph at the right, show the profit maximizing quantity and price, and the amount of profit earned by PGE per month. In the space below, explain why you drew your graph as you did.
B. (5 points) The state requires PGE to upgrade its electrical transmission equipment, increasing PGE’s fixed cost. What is the effect on the profit maximizing quantity and price? On the amount of profit earned by PGE per month? Explain.
Question 2 (18 points total; 8 minutes total)
(For Part B of this question, you should think about article #17, “Wealth Inequality and the Marginal Propensity to Consume.”) When the power went out, many people were unable to work and were not paid for the days the power was out. They will never be able to earn that income; it is simply gone. Suppose the lost wages in one isolated county totals $10,000,000 ($10 million).
A. (8 points total) Why will the total drop in income in that county be more than $10 million? Do not just name a concept here, explain the process fully and completely.
B. (10 points total) Compare 2 communities. Pond County residents are almost all poor. They have no savings, no accumulated wealth, no access to credit. Rain County residents are rich. They have high levels of wealth and easy access to credit. In both communities, the lost wages from the outage total $10,000,000 ($10 million).
In which community – Pond County or Rain County – is the total loss of income larger? Why?
Question 3 (20 points total; 10 minutes total)
Consider PGE’s decision to cut off power, leaving hundreds of thousands of customers without power for hours or days. From PGE’s perspective, the marginal cost of cutting power is the lost revenue – customers who didn’t receive electricity during the outage will have lower electrical bills next month. From PGE’s perspective, the marginal benefit of cutting power is the fires that therefore didn’t start and resulting financial responsibility and lawsuits avoided. The graph at the right captures PGE’s marginal cost and benefit.
Cutting off power generates negative externalities for PGE customers in the form of lost wages, food and medications that spoil and must be discarded, cost of batteries and generator fuel, the emotional stress, and more.
A. (6 points) In the top graph at the right, show the effect of the negative externalities. Label the socially optimal quantity of customers without power, QSOC. Label the privately (PGE) optimal quantity of customers without power, QPGE.
B. (6 points) The state forces PGE to give $100 to each customer who lost power. In the lower graph at the right, show the effect of this penalty on PGE’s optimal quantity of customers without power.
C. (3 points) What information do we need in order to determine if $100 per customer is the optimal penalty?
D. (5 points) Under what circumstances would the socially optimal quantity of customers without power be 0?
Question 4 (4 points; 2 minutes)
Where would the following activity be recorded in the US GDP expenditure accounts? Be sure to indicate both the category ( C I G EX IM or not recorded) and the $ amount.
UCB spends $100,000 on a new Zoom Pro site license to enable classes and office hours to be conducted during a power outage. Zoom Pro pays coders in India $5,000 to do whatever it is coders do to make this thing work.
Question 5 (15 points total; 8 minutes total)
Suppose the economy can be described by the following equations (all values are billions of dollars per month):
C = 100 + 0.8YD EX = 500 TR = 1,000
I = 300 IM = 300 TA = 1,500
G = 400
What is the equilibrium level of output and income? Show all your work or you will receive zero (0) points on this question. If you cannot solve this problem without a calculator, set it up and go as far as you can to receive as much partial credit as possible. No calculators allowed during the exam. Put a box around your final answer.
Question 6 (12 points total; 6 minutes total)
A. (4 points) What is the distinction between nominal GDP and real GDP?
B. (5 points) If nominal GDP rises, does employment necessarily rise? Explain.
C. (3 points) In 2009 in the worst of the Great Recession, annual real GDP in the US was $15 trillion and potential GDP was $16 trillion. How big was the output gap?
Question 7 (16 points total; 8 minutes total)
A. (4 points) Who does investment spending: households, businesses, or governments? What are the three types of spending included in investment spending (I)?
B. (7 points) In our standard model of investment spending, a decrease in interest rates ceteris paribus will increase spending on investment. Explain why.
C. (5 points) PGE predicts fire-season power outages will recur for a decade. The PGE power outages are contributing to heightened uncertainty about the future for California businessowners. Why might heightened uncertainty lead to a decrease in investment spending?
This is the second midterm from Prof. Olney's Fall 2018 offering of Economics 1.
The exam was written as a 50 minute exam but administered over 80 minutes.
Question 1 (15 points total; 8 minutes total)
One contributor to climate change is driving gas-powered vehicles. Economic analysts have estimated that the marginal damage cost associated with the use of gas equals $3.80 per gallon. California’s gas tax is currently 38 cents per gallon.
A. (10 points) At the right, draw two graphs. One should depict the effect of the externality and show both the private and socially optimal quantities of gas. The other graph should depict the market for gas and show the market both without any taxes imposed and with the California 38 cent tax imposed.
B. (5 points) If Proposition 6 on California’s ballot in today’s election passes, California’s gas tax will be decreased from 38 cents to 26 cents per gallon. Will passage of Prop. 6 move California closer to selling the socially optimal quantity of gas? Explain.
Question 2 (10 points total; 5 minutes total)
Suppose that the mpc increases as income declines. As a result, people who make $2 million per year have a relatively low mpc but people who make $60,000 per year have a relatively high mpc. Compare two economies.
Question 3 (15 points, 8 minutes total)
Billz Coffee is a local profit-maximizing coffee shop operating in a monopolistically competitive industry. Billz is initially in long-run equilibrium. But then the building owner where Billz operates its coffee shop increases Billz rent from $5,000 to $8,000 per month.
A. (7 points) At the right, draw the graph showing the initial long-run equilibrium position for Billz, labeling everything with subscripts “1.” Then show the effect of the increase in rent, labeling everything with subscripts “2.”
B. (8 points) Billz pays rent to a landlord for its storefront. When the landlord increases Billz rent from $5,000 to $8,000 per month. What is the short run effect on Billz prices, quantity sold, and profit? In the long run, what will Billz do? What is the effect on prices charged by other coffee shops in the area? Defend your answers.
Question 4 (15 points)
Suppose the economy can be described by the following equations (all values are billions of dollars per year)
C = 1500 + 0.8YD G = 2000 EX = 1000 TR = 500 I = 1800 IM = 1500 TA = 1500
What is the equilibrium level of output and income? Show all your work or you will receive zero (0) points on this question. If you cannot solve this problem without a calculator, set it up and go as far as you can to receive as much partial credit as possible. No calculators allowed during the exam.
Question 5 (30 points total; 18 minutes total)
For reasons we will explore later in November, the Federal Reserve (Fed) can change interest rates. For now, don’t worry about how or why they change interest rates.
A. (8 points) Suppose that the Fed increases interest rates. At the same time, businesspeople become pessimistic about the future and decrease their estimates of future sales. What is the effect of these two events on investment spending? Explain.
B. (12 points) The Fed increases interest rates. No other country increases its interest rates. Does the US dollar rise or fall vis a vis other currencies? What is the effect on exports? On imports? Explain the process by which these effects occur. Be complete.
C. (10 points) Compare two countries.
Question 6 (7 points; 4 minutes)
Write a paragraph that summarizes the current state of the U.S. economy.
Question 7 (8 points; 4 minutes)
This question is based on article #15, “5 Ways GDP Gets it Totally Wrong as a Measure of our Success” by David Pilling. What is the definition of gross domestic product (GDP)? What does it mean to say “GDP is a measure of income, not of wealth”? Cite and discuss one of the five ways the author cites as a problem with using GDP as the sole indicator of economic conditions.
One contributor to climate change is driving gas-powered vehicles. Economic analysts have estimated that the marginal damage cost associated with the use of gas equals $3.80 per gallon. California’s gas tax is currently 38 cents per gallon.
A. (10 points) At the right, draw two graphs. One should depict the effect of the externality and show both the private and socially optimal quantities of gas. The other graph should depict the market for gas and show the market both without any taxes imposed and with the California 38 cent tax imposed.
B. (5 points) If Proposition 6 on California’s ballot in today’s election passes, California’s gas tax will be decreased from 38 cents to 26 cents per gallon. Will passage of Prop. 6 move California closer to selling the socially optimal quantity of gas? Explain.
Question 2 (10 points total; 5 minutes total)
Suppose that the mpc increases as income declines. As a result, people who make $2 million per year have a relatively low mpc but people who make $60,000 per year have a relatively high mpc. Compare two economies.
• Economy A has the 1980 US income distributionThe government gives everyone a check (a transfer payment) equal to 10% of their usual income. In which economy – Economy A or Economy B – would these checks have a greater effect on consumption? Explain. Start your explanation by stating the difference between the 1980 & current US income distributions, based on the article #13a, “Striking it Richer: The Evolution of Top Incomes in the United States,” by Emmanuel Saez.
• Economy B has today’s US income distribution
Question 3 (15 points, 8 minutes total)
Billz Coffee is a local profit-maximizing coffee shop operating in a monopolistically competitive industry. Billz is initially in long-run equilibrium. But then the building owner where Billz operates its coffee shop increases Billz rent from $5,000 to $8,000 per month.
A. (7 points) At the right, draw the graph showing the initial long-run equilibrium position for Billz, labeling everything with subscripts “1.” Then show the effect of the increase in rent, labeling everything with subscripts “2.”
B. (8 points) Billz pays rent to a landlord for its storefront. When the landlord increases Billz rent from $5,000 to $8,000 per month. What is the short run effect on Billz prices, quantity sold, and profit? In the long run, what will Billz do? What is the effect on prices charged by other coffee shops in the area? Defend your answers.
Question 4 (15 points)
Suppose the economy can be described by the following equations (all values are billions of dollars per year)
C = 1500 + 0.8YD G = 2000 EX = 1000 TR = 500 I = 1800 IM = 1500 TA = 1500
What is the equilibrium level of output and income? Show all your work or you will receive zero (0) points on this question. If you cannot solve this problem without a calculator, set it up and go as far as you can to receive as much partial credit as possible. No calculators allowed during the exam.
Question 5 (30 points total; 18 minutes total)
For reasons we will explore later in November, the Federal Reserve (Fed) can change interest rates. For now, don’t worry about how or why they change interest rates.
A. (8 points) Suppose that the Fed increases interest rates. At the same time, businesspeople become pessimistic about the future and decrease their estimates of future sales. What is the effect of these two events on investment spending? Explain.
B. (12 points) The Fed increases interest rates. No other country increases its interest rates. Does the US dollar rise or fall vis a vis other currencies? What is the effect on exports? On imports? Explain the process by which these effects occur. Be complete.
C. (10 points) Compare two countries.
• Country O: A large share of the spending of residents of country O is for imported goods and services.In which country – country O or country C – will a recession caused by an increase in interest rates be more severe? Carefully explain your answer.
• Country C: Because of high tariffs, very little of the spending of residents of country C is for imported goods and services.
Question 6 (7 points; 4 minutes)
Write a paragraph that summarizes the current state of the U.S. economy.
Question 7 (8 points; 4 minutes)
This question is based on article #15, “5 Ways GDP Gets it Totally Wrong as a Measure of our Success” by David Pilling. What is the definition of gross domestic product (GDP)? What does it mean to say “GDP is a measure of income, not of wealth”? Cite and discuss one of the five ways the author cites as a problem with using GDP as the sole indicator of economic conditions.
This is the second midterm from Prof. Olney's Fall 2017 offering of Economics 1.
The exam was written as a 50 minute exam but administered over 80 minutes.
Question 1 (12 points; 6 minutes)
Suppose the economy can be described by the following equations (all values are billions of dollars per year)
C = 900 + 0.6YD G = 800 EX = 200 TR = 100 I = 300 IM = 300 TA = 600
What is the equilibrium level of output and income? Show all your work or you will receive zero (0) points on this question. If you cannot solve this problem without a calculator, set it up and go as far as you can to receive as much partial credit as possible. No calculators allowed during the exam.
Question 2 (15 points, 8 minutes)
A) (5 points) Provide an example of an activity that would be recorded in both C and IM in the U.S. expenditure accounts. Your example should have $ values associated with it. What $ amount would be recorded in C? What $ amount would be recorded in IM?
B) (5 points) Is the U.S. economy currently in an unemployment equilibrium? Defend your answer.
C) (5 points) Real GDP is tightly linked to (that is, correlated with) employment. Explain why nominal GDP is not tightly linked to employment.
Question 3 (20 points total; 10 minutes total)
Part b of this question is based on two articles:
• #10b, “Economic Growth in the United States: A Tale of Two Countries,” by Thomas Piketty, Emmanuel Saez, and Gabriel Zucman. Washington Center for Equitable Growth blog, December 6, 2016.
• #18, “Wealth Inequality and the Marginal Propensity to Consume,” by Nick Bunker, Washington Center for Equitable Growth, December 17, 2014.
A) (10 points) A cut in taxes boosts disposable income, leading households to increase consumer spending. Explain why the total increase in GDP should be larger than the initial increase in consumer spending triggered by a tax cut. Be clear and be complete. Simply mentioning the name of a concept is insufficient.
B) (10 points) Suppose that the top 1 percent income earners studied in the work by Piketty, Saez, and Zucman (shorthand “PSZ,” #10b) have much greater wealth than the bottom 50 percent studied by PSZ. Over the period 1962-2014, what were the patterns of the share of income accruing to the bottom 50 percent and the top 1 percent of income earners? Based on the findings in the Bunker article (#18), what is the effect of those patterns shown in PSZ on the size of the multiplier over the period 1962-2014? Explain your answer. (Your answer should make it clear that you read the articles.)
Question 4 (25 points total; 13 minutes total)
Inspired by https://ww2.kqed.org/news/2017/10/30/is-a-hollywood-tax-credit-still-needed-to-protect-industry-jobs/
Consider the activity “filming a movie or TV series.” Hollywood film studios employ a large number of people when they make a movie or shoot a television series. Although the studios have their headquarters in Hollywood, CA, they can choose where to do the filming – in California or elsewhere. Starting in 2014, the state of California offered large subsidies to film studios that chose to do their filming in California rather than elsewhere.
A) (4 points) Give and defend one example of a positive externality associated with filming a movie or TV series in California.
B) (5 points) Is filming a movie or TV series a situation in which the Coase Theorem applies? Defend your answer.
C) (10 points) California pays subsidies of $330 million annually to Hollywood film studios who choose to film in California. Draw graphs that illustrate the positive externality associated with filming in California and, separately, the effect of the subsidy. The quantity is the number of movies or TV episodes filmed in CA per year.
D) (6 points) State legislators have to decide soon whether to extend the subsidy program beyond its expiration in 2020. What do they need to know in order to determine if the subsidy is the optimal size? Explain.
Question 5 (16 points; 8 minutes)
A) (8 points) Why does a decrease in interest rates typically lead to an increase in investment spending? In your answer, be sure to distinguish between the interest rate(s) that are relevant for firms using internal finance versus the interest rate(s) that are relevant for firms using external finance.
B) (8 points) The expected rate of return on a potential investment project is 2 percent. That 2 percent is a mean (or, average) of a distribution of possible returns ranging from -1 to +3 percent. If the business owners are loss averse, will a drop in interest rates from 2.5 to 1.5 percent necessarily lead to an increase in investment spending? Explain your answer. (Your explanation should make it clear to your GSI that you know what it means to be “loss averse.”)
Question 6 (12 points total; 6 minutes total)
A) (6 points) At the right, draw a graph that shows a monopolistically competitive firm in long run equilibrium.
B) (6 points) For a monopoly, profit can be greater than zero in the long run. Explain why profit is equal to zero in the long run for a monopolistically competitive firm but not for a monopolist.
This is the second midterm from Prof. Olney's Fall 2016 offering of Economics 1.
The exam was written as a 50 minute exam but administered over 80 minutes.
Question 1 (15 points; 8 minutes)
Suppose the economy can be described by the following equations (all values are billions of dollars per month)
C = 180 + 0.4YD EX = 200 TR = 400 I = 100 IM = 100 TA = 600 G = 300
What is the equilibrium level of output and income? Show all your work or you will receive zero (0) points on this question. If you cannot solve this problem without a calculator, set it up and go as far as you can to receive as much partial credit as possible. No calculators allowed during the exam.
Question 2 (6 points, 3 minutes)
Where are each of the following activities recorded in the U.S. GDP expenditure accounts? (Possible answers: C, I, G, EX, IM, or not recorded) Defend your answers.
During World War II, the U.S. federal government increased its purchases of good and services from $6.5 billion in 1940 to almost $100 billion in 1944. GDP in 1940 was $101 billion, so you can see what an enormous increase in G this was.
a) (10 points) Explain why the total increase in GDP should be larger than the initial increase in government spending. Be clear and be complete. Simply mentioning the name of a concept is insufficient.
b) (7 points) During World War II, U.S. consumers faced “consumer rationing.” Consumers were not allowed to purchase cars and appliances. Consumers could purchase other items such as sugar, flour, and meat, only in limited amounts. Explain why the change in GDP from each additional $1 billion in government spending is smaller when there is rationing during World War II than when there is no rationing after the war.
Question 4 (20 points total; 10 minutes total)
An oil or gas pipeline laid across land creates the risk of environmental damage from leaks or explosion and fire (such as the explosion in Alabama on October 31). A large private oil company wants to construct a pipeline across land in the upper midwest of the United States. Thousands of people who live near the proposed pipeline are opposed to its construction and want construction stopped.
a) (6 points) Is this a situation in which the Coase Theorem applies? Why or why not?
b) (14 points) Two proposals have been offered to address the concerns of people opposed to the pipeline construction.
• Proposal 1: Make the oil company pay a penalty now to offset the expected costs of future leaks or other environmental damage
• Proposal 2: Stop construction of the pipeline
Under what conditions would proposal 1 generate the socially optimal quantity of pipeline construction? Is there a situation in which proposal 2 would generate the socially optimal quantity of pipeline construction? Explain your answers. Draw a graph at the right that demonstrates a situation in which proposal 2 is optimal.
Question 5 (10 points; 5 minutes)
Under the Affordable Care Act (also known as Obamacare), everyone is required to do one of two things:
• Have health insurance coverage
• Pay a penalty for not being insured. The minimum penalty for 2017 is $695
The population can be divided into two groups of people: [1] healthy people under the age of 30 and [2] everyone else, including the unhealthy people. If healthy people under the age of 30 choose to pay the penalty rather than buy insurance, use asymmetric information concepts to explain what will happen in health insurance markets over time.
Question 6 (6 points; 3 minutes)
Based on the article “The Problem with Poor Countries’ GDP,” by Bill Gates, Project Syndicate, May 6, 2013, discuss why household surveys would provide better information than official GDP statistics for policy makers working in very poor countries.
Question 7 (10 points; 5 minutes)
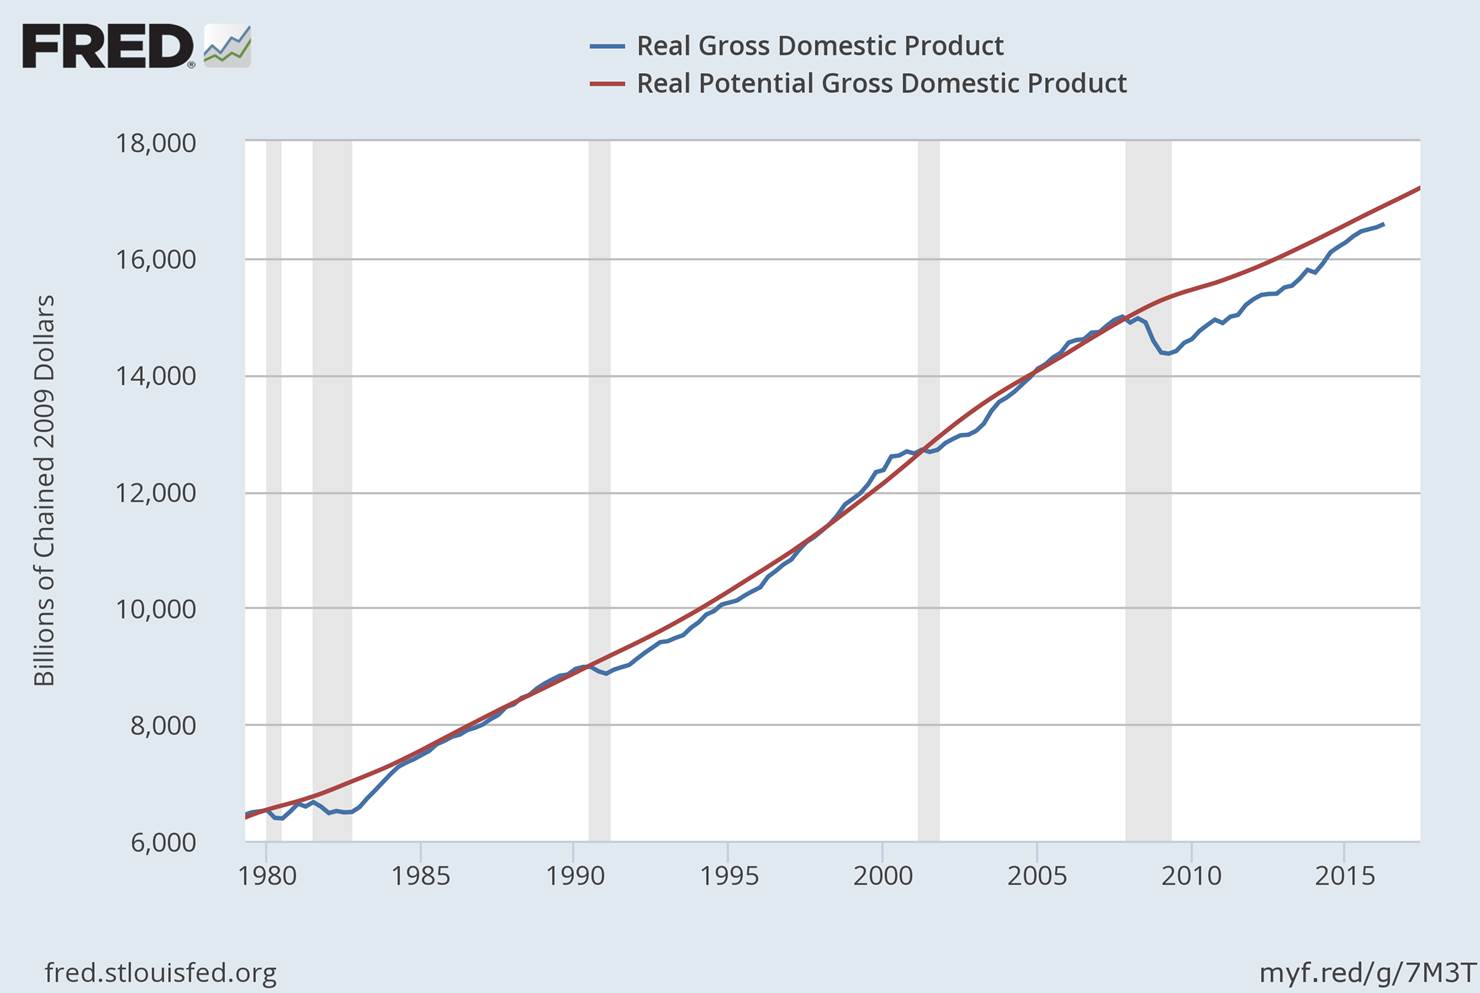 This graph shows actual real GDP
(dashed line) for the U.S. and the Congressional Budget Office
(CBO) estimate of potential real GDP (solid line). The CBO
estimate is the official estimate of what the U.S. economy could
produce at full employment. Based on the graph, in what
time periods was the U.S. economy operating on its production
possibilities frontier? Is the U.S. economy currently in
an unemployment equilibrium? Defend your answers.
This graph shows actual real GDP
(dashed line) for the U.S. and the Congressional Budget Office
(CBO) estimate of potential real GDP (solid line). The CBO
estimate is the official estimate of what the U.S. economy could
produce at full employment. Based on the graph, in what
time periods was the U.S. economy operating on its production
possibilities frontier? Is the U.S. economy currently in
an unemployment equilibrium? Defend your answers.
Question 8 (16 points total; 8 minutes total)
The restaurant industry can be described as monopolistically competitive.
a) (6 points) Draw a graph that depicts a typical restaurant in the restaurant industry in long run equilibrium.
b) (10 points) When the economy entered the Great Recession, job losses and income cuts lowered the demand for restaurant meals. What is the effect on the typical restaurant in the short run? In the long run? Explain your answers.
Suppose the economy can be described by the following equations (all values are billions of dollars per month)
C = 180 + 0.4YD EX = 200 TR = 400 I = 100 IM = 100 TA = 600 G = 300
What is the equilibrium level of output and income? Show all your work or you will receive zero (0) points on this question. If you cannot solve this problem without a calculator, set it up and go as far as you can to receive as much partial credit as possible. No calculators allowed during the exam.
Question 2 (6 points, 3 minutes)
Where are each of the following activities recorded in the U.S. GDP expenditure accounts? (Possible answers: C, I, G, EX, IM, or not recorded) Defend your answers.
A California resident buys a copy of today’s New York TimesQuestion 3 (17 points total; 9 minutes total)
A small business in California buys a copy of today’s New York Times
The Berkeley Public Library buys a copy of today’s New York Times
An international student attending UC Berkeley buys a copy of today’s New York Times
During World War II, the U.S. federal government increased its purchases of good and services from $6.5 billion in 1940 to almost $100 billion in 1944. GDP in 1940 was $101 billion, so you can see what an enormous increase in G this was.
a) (10 points) Explain why the total increase in GDP should be larger than the initial increase in government spending. Be clear and be complete. Simply mentioning the name of a concept is insufficient.
b) (7 points) During World War II, U.S. consumers faced “consumer rationing.” Consumers were not allowed to purchase cars and appliances. Consumers could purchase other items such as sugar, flour, and meat, only in limited amounts. Explain why the change in GDP from each additional $1 billion in government spending is smaller when there is rationing during World War II than when there is no rationing after the war.
Question 4 (20 points total; 10 minutes total)
An oil or gas pipeline laid across land creates the risk of environmental damage from leaks or explosion and fire (such as the explosion in Alabama on October 31). A large private oil company wants to construct a pipeline across land in the upper midwest of the United States. Thousands of people who live near the proposed pipeline are opposed to its construction and want construction stopped.
a) (6 points) Is this a situation in which the Coase Theorem applies? Why or why not?
b) (14 points) Two proposals have been offered to address the concerns of people opposed to the pipeline construction.
• Proposal 1: Make the oil company pay a penalty now to offset the expected costs of future leaks or other environmental damage
• Proposal 2: Stop construction of the pipeline
Under what conditions would proposal 1 generate the socially optimal quantity of pipeline construction? Is there a situation in which proposal 2 would generate the socially optimal quantity of pipeline construction? Explain your answers. Draw a graph at the right that demonstrates a situation in which proposal 2 is optimal.
Question 5 (10 points; 5 minutes)
Under the Affordable Care Act (also known as Obamacare), everyone is required to do one of two things:
• Have health insurance coverage
• Pay a penalty for not being insured. The minimum penalty for 2017 is $695
The population can be divided into two groups of people: [1] healthy people under the age of 30 and [2] everyone else, including the unhealthy people. If healthy people under the age of 30 choose to pay the penalty rather than buy insurance, use asymmetric information concepts to explain what will happen in health insurance markets over time.
Question 6 (6 points; 3 minutes)
Based on the article “The Problem with Poor Countries’ GDP,” by Bill Gates, Project Syndicate, May 6, 2013, discuss why household surveys would provide better information than official GDP statistics for policy makers working in very poor countries.
Question 7 (10 points; 5 minutes)
This graph shows actual real GDP
(dashed line) for the U.S. and the Congressional Budget Office
(CBO) estimate of potential real GDP (solid line). The CBO
estimate is the official estimate of what the U.S. economy could
produce at full employment. Based on the graph, in what
time periods was the U.S. economy operating on its production
possibilities frontier? Is the U.S. economy currently in
an unemployment equilibrium? Defend your answers.Question 8 (16 points total; 8 minutes total)
The restaurant industry can be described as monopolistically competitive.
a) (6 points) Draw a graph that depicts a typical restaurant in the restaurant industry in long run equilibrium.
b) (10 points) When the economy entered the Great Recession, job losses and income cuts lowered the demand for restaurant meals. What is the effect on the typical restaurant in the short run? In the long run? Explain your answers.
This is the second midterm from Prof. Olney's Fall 2015 offering of Economics 1. The exam was written as a 50 minute exam.
Question 1 (15 points; 7 minutes)
Suppose the economy can be described by the following equations (all values are billions of dollars per year):
C = 2,800 + 0.4YD EX = 3,000 TR = 1,000
I = 2,000 IM = 1,000 + 0.1Y TA = 3,000
G = 1,000
What is the equilibrium level of output and income? Show all your work or you will receive zero (0) points on this question. If you cannot solve this problem without a calculator, set it up and go as far as you can to receive as much partial credit as possible. No calculators allowed during the exam.
Question 2 (5 points, 2 minutes)
Where is the following activity recorded in the U.S. GDP expenditure accounts? (Possible answers: C, I, G, EX, IM, or not recorded) Defend your answer.
Google pays $200,000 per month to a bus company that will drive Google employees to and from work
Question 3 (10 points; 4 minutes)
Many economists think the U.S. economy is at full employment whenever the unemployment rate is 5 percent or lower. The unemployment rate for October 2015, announced Friday morning, was 5.0 percent.
a. (4 points) Are we in an “unemployment equilibrium”? Explain.
b. (6 points) Referring to article #16 (“Yellen's Philosophy: The More Jobs Data, the Better”), what are 2 other items of jobs data you could gather to determine whether the U.S. economy is on or inside of its production possibilities frontier (PPF)? For each item, what information does it provide about the economy?
Question 4 (10 points, 4 minutes)
a. (4 points) Why can’t monopolistically competitive firms earn economic profit in the long run?
b. (6 points) Why is the adjustment to long run equilibrium shown as a shift of demand in monopolistic competition but as a shift of supply in perfect competition?
Question 5 (35 points; 16 minutes) In Fall 2008, interest rates in the U.S. were decreased.
a) (6 points) How should investment spending have reacted to the Fall 2008 drop in interest rates? Explain why.
b) (7 points) In Fall 2008, the economy was collapsing rapidly and most people were surprised and confused. Business uncertainty rose dramatically. With reference to article #20 in the reader (“Holding on for Tomorrow: How Economic Uncertainty Dulls Investment,” explain why a rise in uncertainty affects investment spending.
c) (12 points) Assuming only U.S. interest rates were decreased in Fall 2008, how should net exports (EX - IM) have reacted to the drop in interest rates? Explain why.
d) (10 points) Explain why the total change in real GDP would be larger than the initial change in investment + the initial change in net exports.
Question 6 (10 points; 4 minutes)
According to the study by Chris Carroll et al cited in article #17a by Nick Bunker (“Wealth Inequality and the Marginal Propensity to Consume”) middle-income families have a larger mpc than do wealth families. In which case below would the multiplier be larger? Explain why.
• (Today) When the wealthy owners of consumer goods companies are paid 300 times as much as the typical worker in their companies, as is true today, or
• (50 years ago) When the wealthy owners of consumer goods companies are paid 20 times as much as the typical worker in their companies, as was true fifty years ago
Question 7 (15 points, 7 minutes)
San Franciscans who work at tech companies such as Google and Apple can ride to work for free on “tech shuttles” – large luxury busses that seat 120 people.
• Fans of the shuttles note that each 120-seat bus represents 120 fewer cars commuting on the freeways, decreasing pollution and traffic
• Opponents of the shuttles argue that the large busses allow tech workers to live far from the office, promoting gentrification.
Tech companies pay the entire cost of providing the shuttle. In addition, they also pay San Francisco a fee to operate in The City.
Instead of being charged fees, should the tech shuttles be subsidized by local government? Defend your answer, using economic language. State any necessary assumptions explicitly. Draw graph(s) as appropriate.